
Puget Bench for Unreal Engine
Our benchmarks are designed in partnership with hardware and software industry leaders, as well as end users and influencers who use Unreal Engine daily, to ensure that they are representative of real-world workflows.
Quickly Jump To: Key Features • Hardware Requirements • Test Breakdown • Scoring • Update Log • Beta Versions
Puget Bench for Unreal Engine is currently in BETA. Development is ongoing, and results/scoring are expected to change before the public release.
Puget Bench for Unreal Engine runs on top of your installed copy of Unreal Engine Editor, providing benchmark data directly from the application. Our benchmarks are designed in partnership with hardware and software industry leaders, as well as end users and influencers who use Unreal Engine daily, to ensure that they are representative of real-world workflows.
Key Features

Realistic Testing
Interfaces with Unreal Engine and benchmarks real-world projects.


Hardware Requirements
Windows
- Unreal Engine 5.8 or newer
- CPU
- Intel/AMD: CPU meeting the System Requirements for Unreal Engine
- ARM: Snapdragon X2 recommended with 32.0.172.1 GPU driver or newer
- 32GB of RAM or more
- GPU w/ at least 10GB of VRAM
- AMD Radeon™ RX 6000 Series or newer
- Intel® Arc™ A-Series or newer
- NVIDIA GeForce RTX™ 20 Series or newer
- NVIDIA Quadro RTX™ or RTX PRO™
- 60GB+ free disk space
- Windows 11 64-bit
- Unreal Engine/OS language must be set to English
- Software: Microsoft Visual C++ Redistributable version 14.50.35719 or higher
MacOS
- Unreal Engine 5.8 or newer
- 32GB of RAM
- MacOS Sonoma 14
- 60GB+ free disk space
- Unreal Engine/OS language must be set to English
- Software: Xcode (installed, license agreed, and metal toolchain installed xcodebuild -downloadComponent MetalToolchain)
Test Breakdown
Our Unreal Engine benchmark is broken down into six categories:
- Compile Shaders
- Chaos Simulation
- Niagara Simulation
- Asset and Scene Initialization
- Movie Render
- Editor Runtime
Shown below is a breakdown of the tests for the above categories, including basic composition settings as well as a description of the contents and an explanation of how the test is performed. Each entry also includes a “Processing Type” entry that indicates what hardware is the primary contributor to performance (CPU or GPU). This was determined by comparing results between mid-range and high-end CPUs and GPUs to determine which has the greater impact on performance.
Puget Bench for Unreal Engine Level Renders
Compile Shaders
The Compile Shaders test is designed to replicate the experience of users when opening a project on their system for the first time. To do so, we clear the DDC and Zen cache files, then open the benchmark project with the additional arguments “-ddc=cold -ForceShaderCompilation”, which forces re-generation of the shaders.
We record the time it takes to compile shaders as reported in the Unreal Engine log file. This removes the extra time required to set up Python dependencies, configure plugins, etc.
Chaos Simulation
The Chaos Simulation tests are designed to measure the performance of various aspects of Chaos – Unreal Engine’s physics and destruction system. Chaos tends to be CPU-heavy, with minimal GPU acceleration.
Performance for these tests is measured in a floating editor viewport set to 1920×1080. Tests are run for 30 seconds, with an additional 2 seconds of unrecorded buffer at the end to allow Unreal Engine to safely tear down the window. The benchmark calculates FPS by measuring the time between each game tick during the run, converting each interval into an FPS value, and then averaging those values together.
| Test Name | Benchmark Preset | Processing Type | Description |
|---|---|---|---|
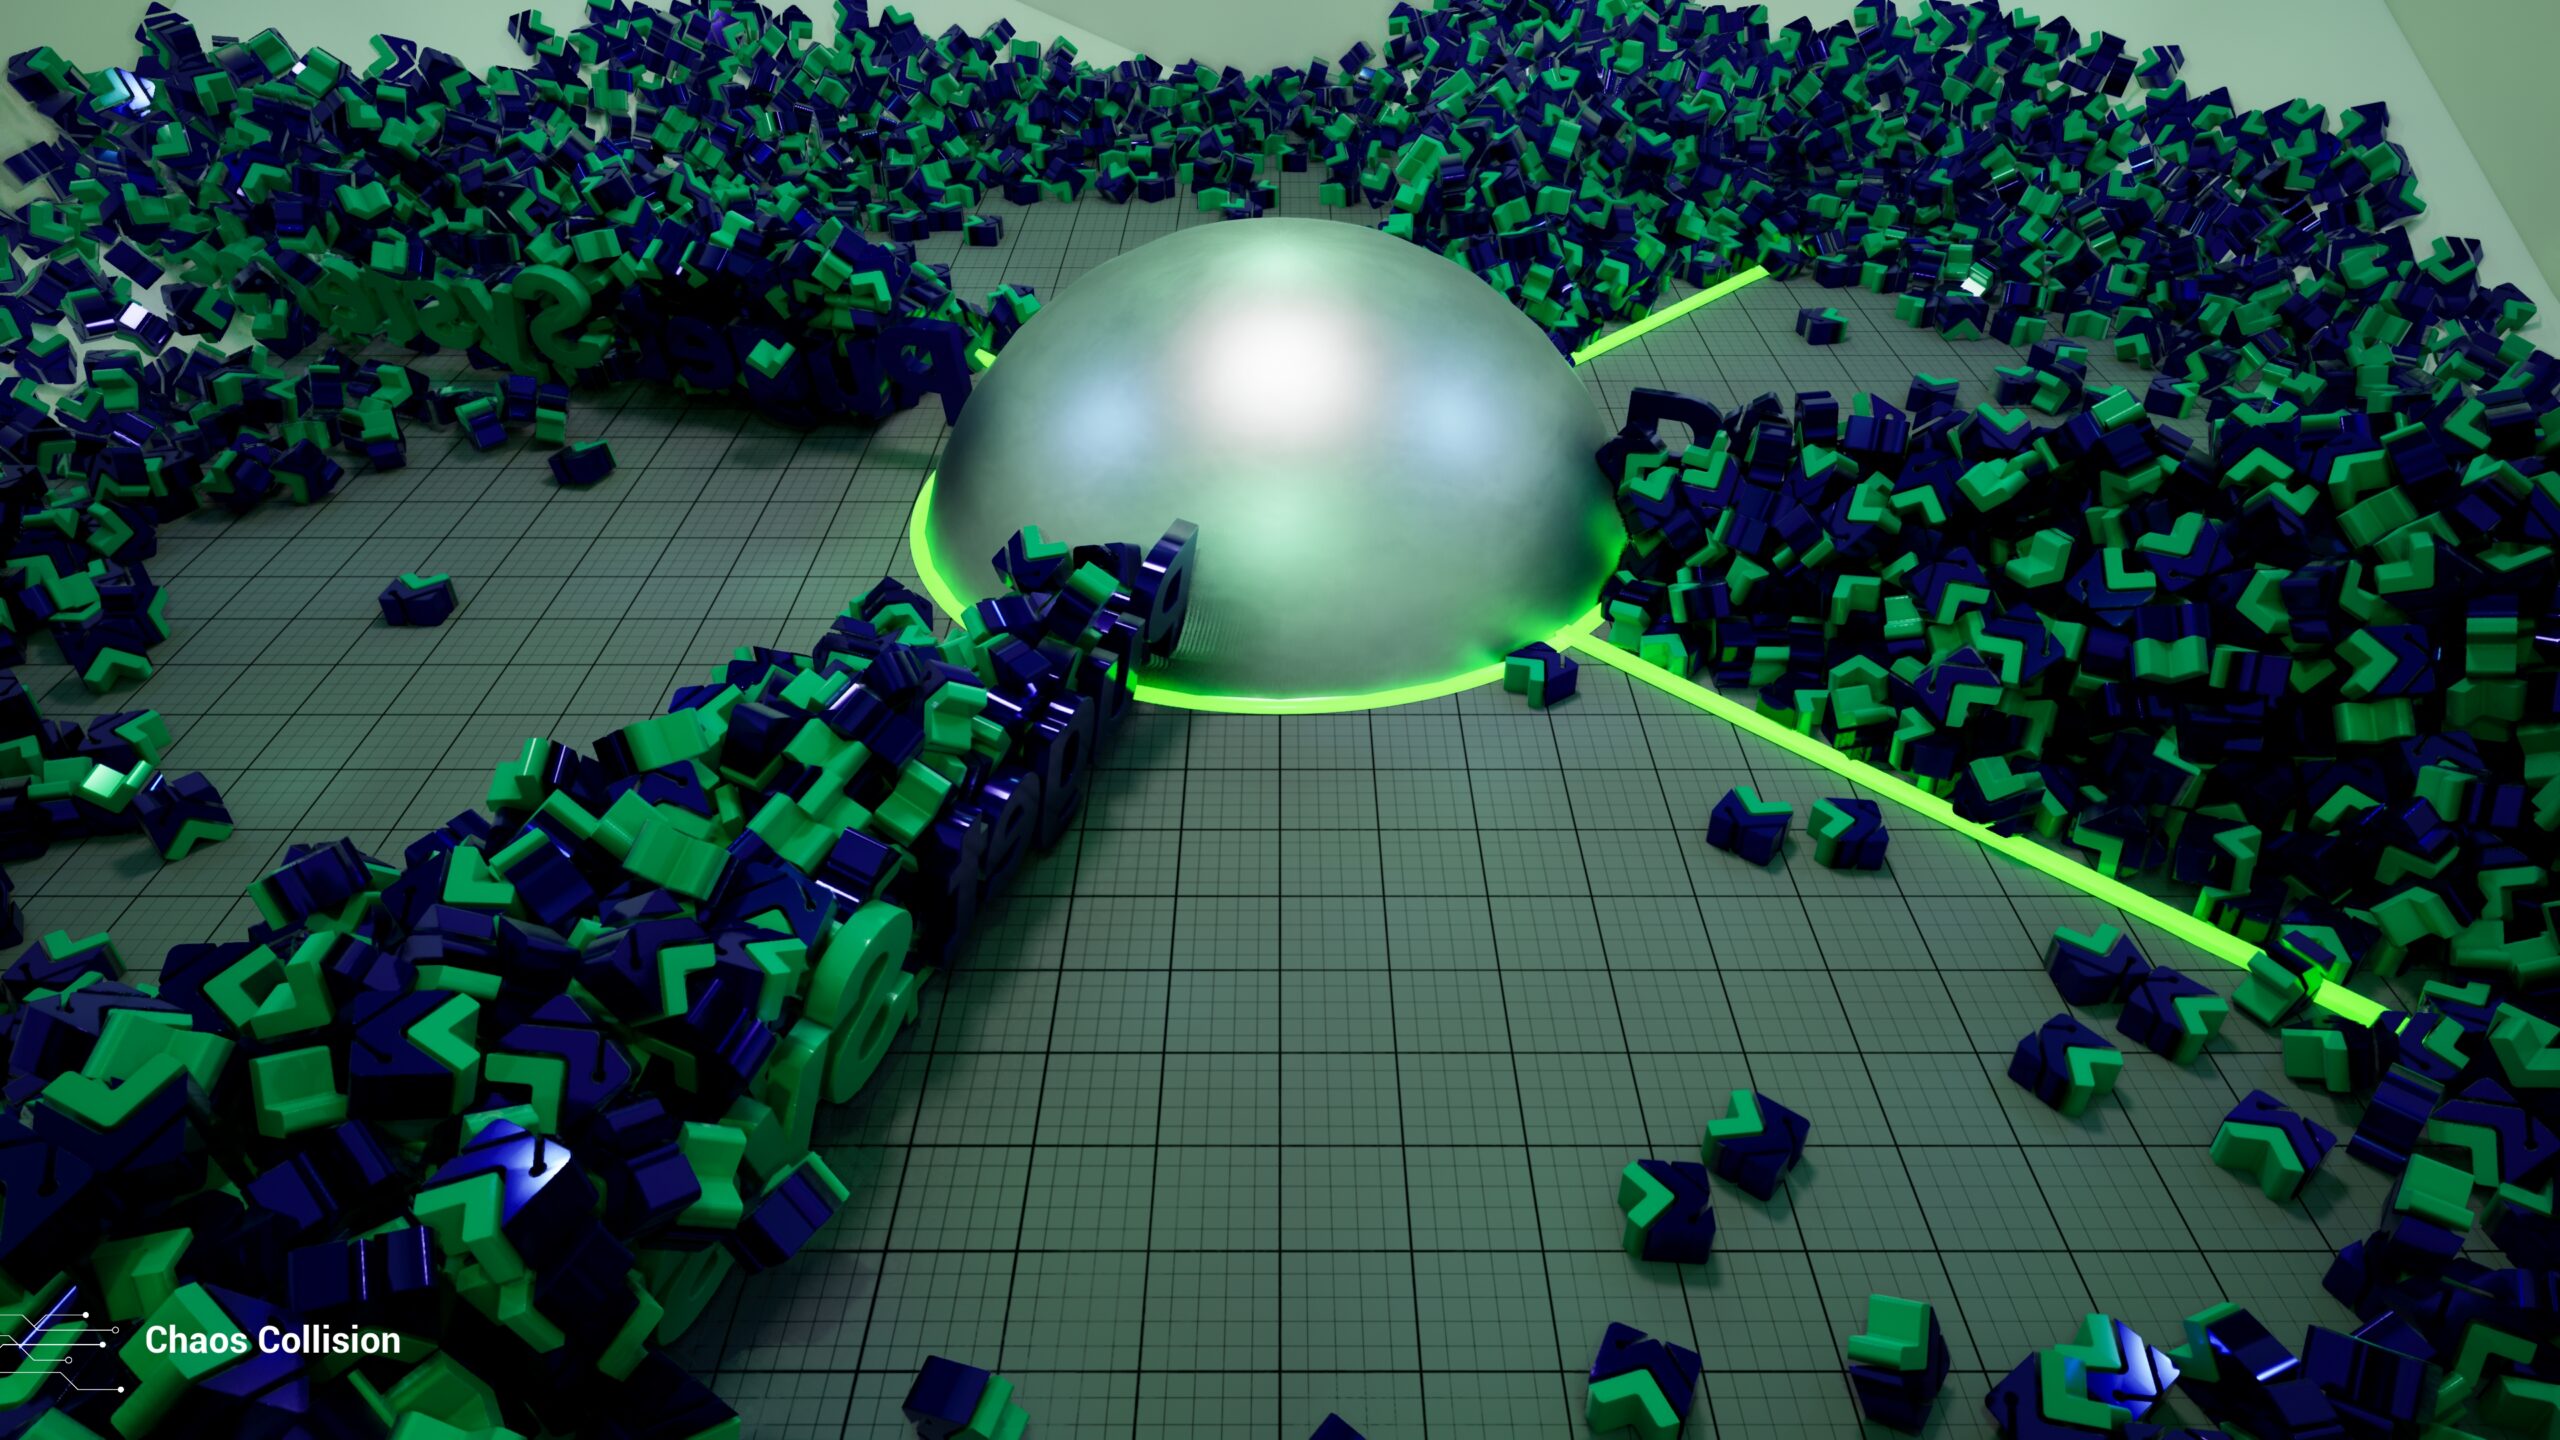
| Chaos Collision | Standard, Extended | CPU | The Chaos Collision Test uses approximately 4,000 instances of a static mesh configured with Simple Collision using 26DOP geometry to stress Unreal Engine’s Chaos rigid body simulation and collision systems. The scene consists of multiple rotating “windmill” blade assemblies that continuously interact with and disturb the simulated objects, creating a high volume of dynamic contacts, collision events, and rigid body solver interactions. |
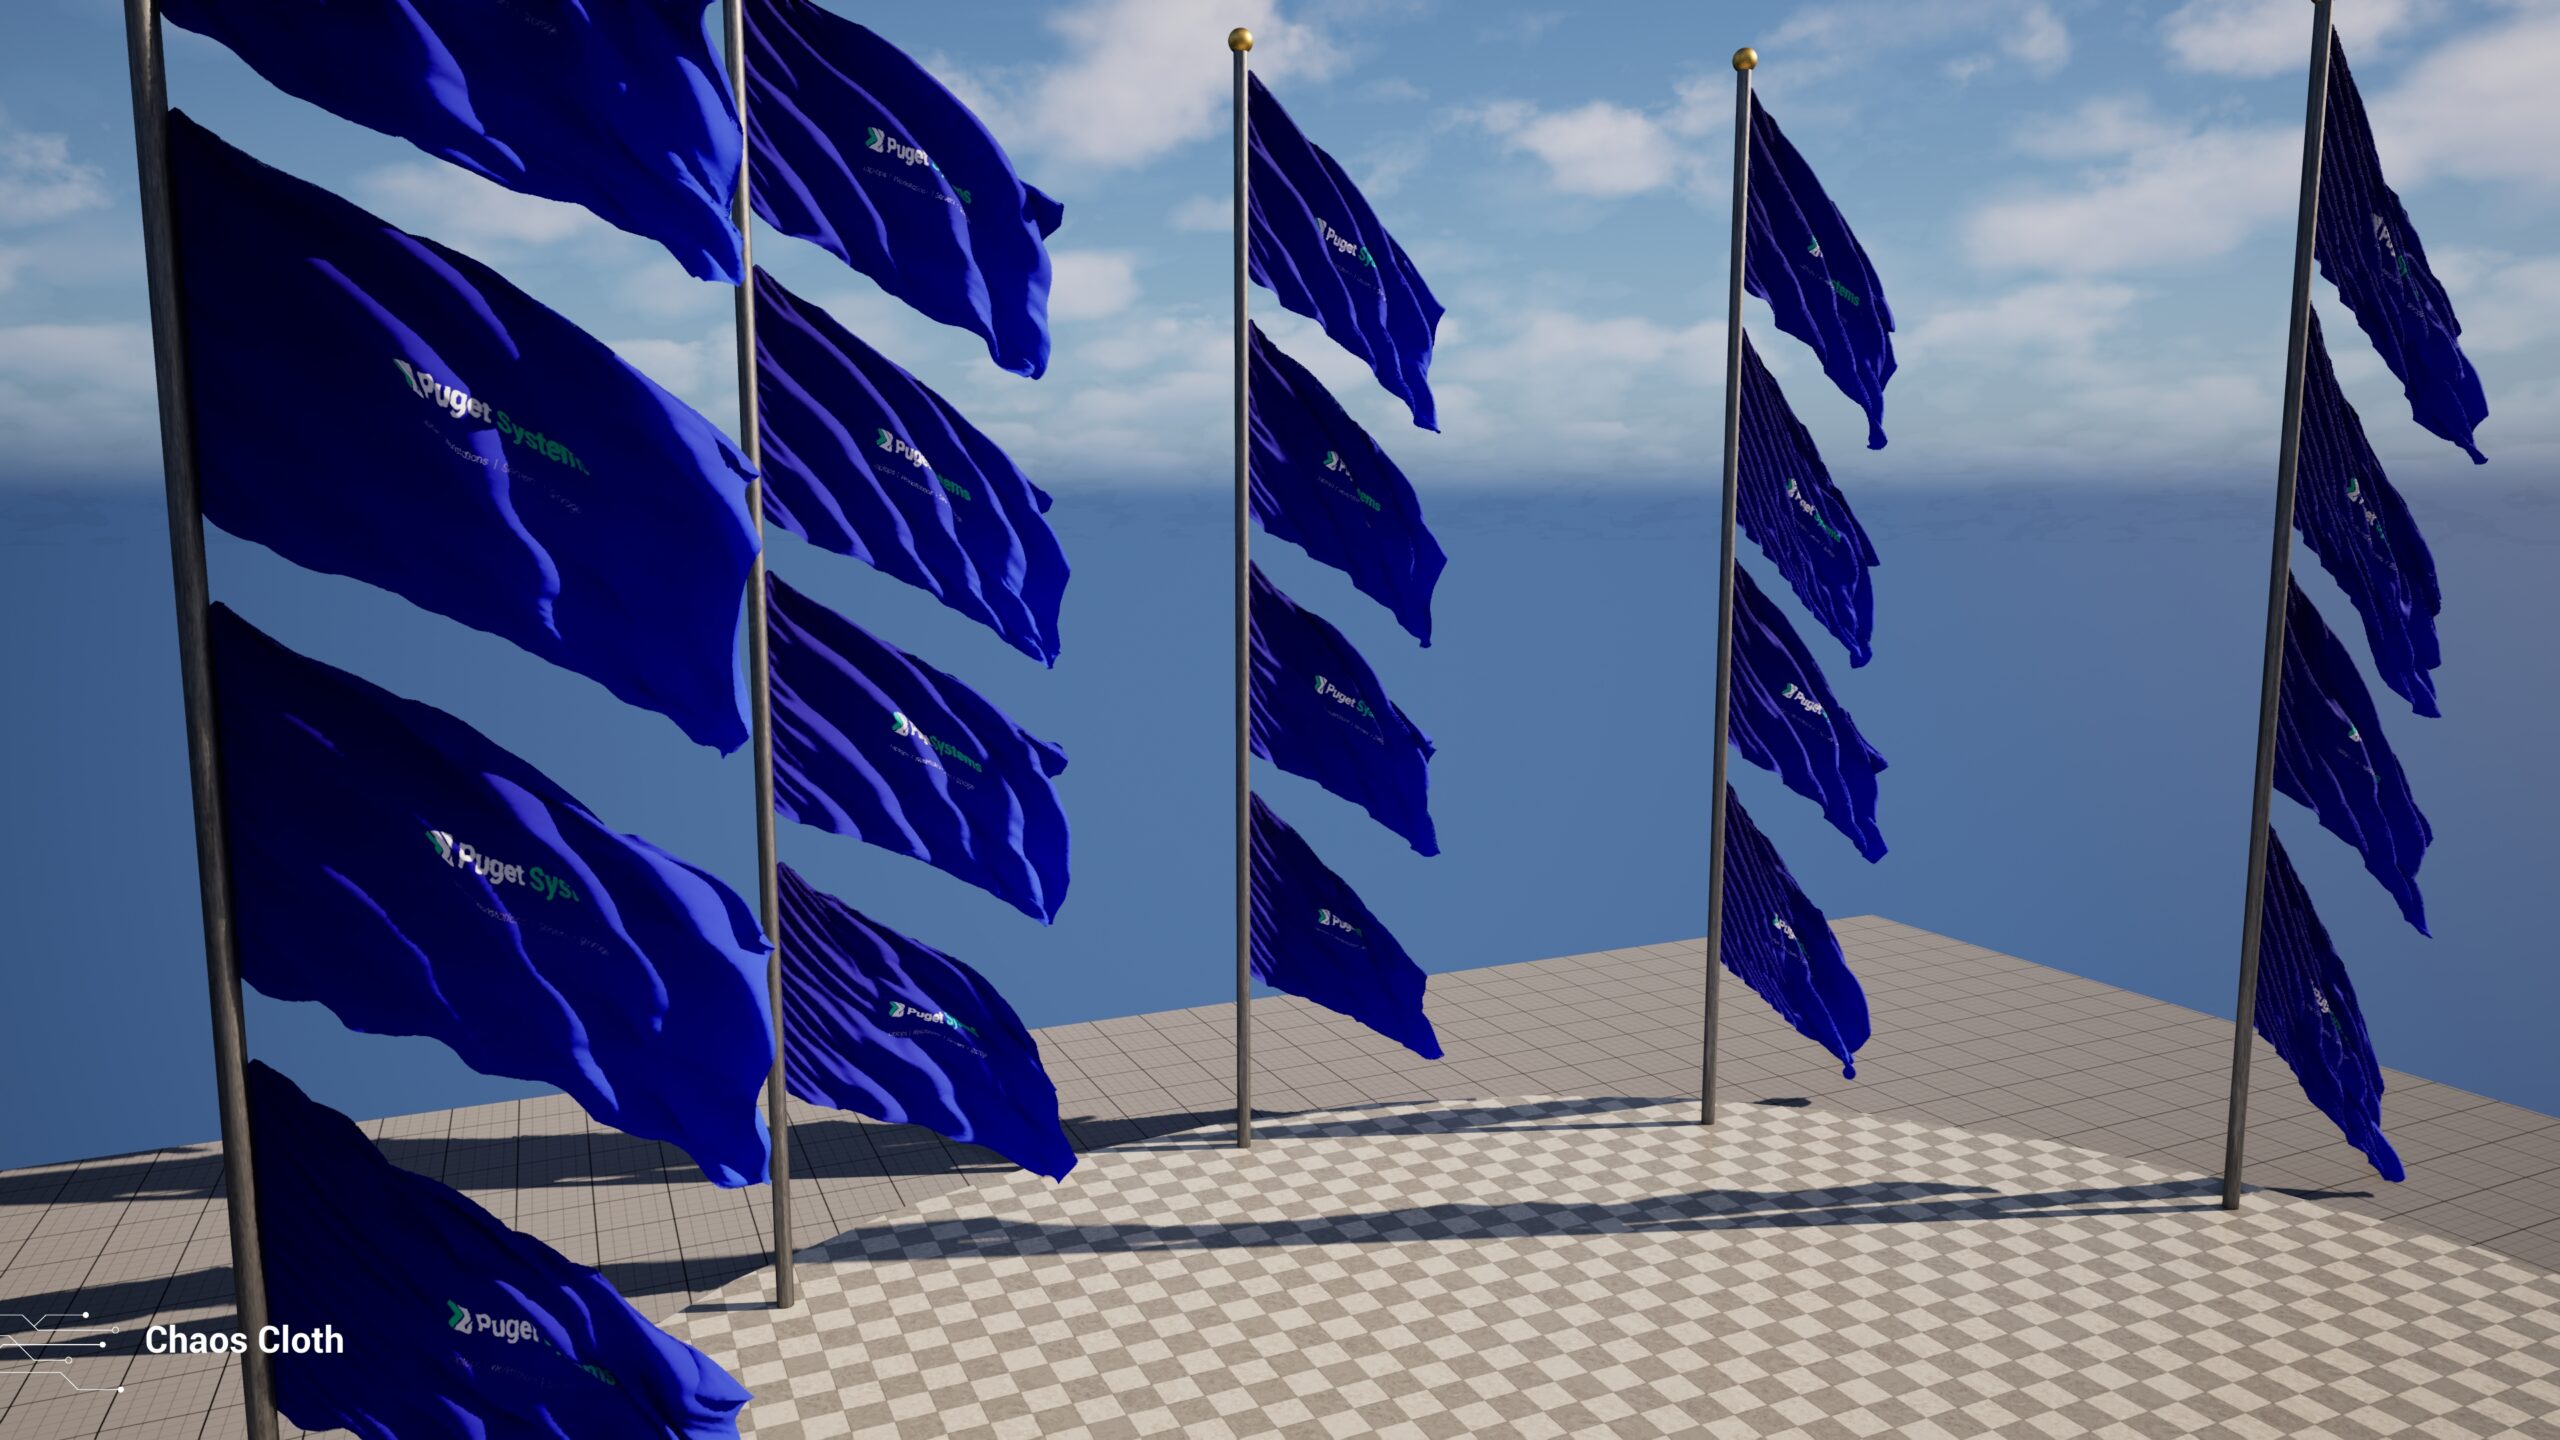
| Chaos Cloth | Standard, Extended | CPU | The Chaos Cloth Test uses 20 simultaneously simulated flag cloth assets with each flag driven by a point wind source. The cloth asset contains ~59k triangles, ~30k vertices, and ~30k dynamic particles, resulting in approximately ~600k dynamic cloth particles simulated across the scene. The test uses Chaos Cloth with 1 solver iteration, up to 10 maximum iterations, and 1 subdivision level. |
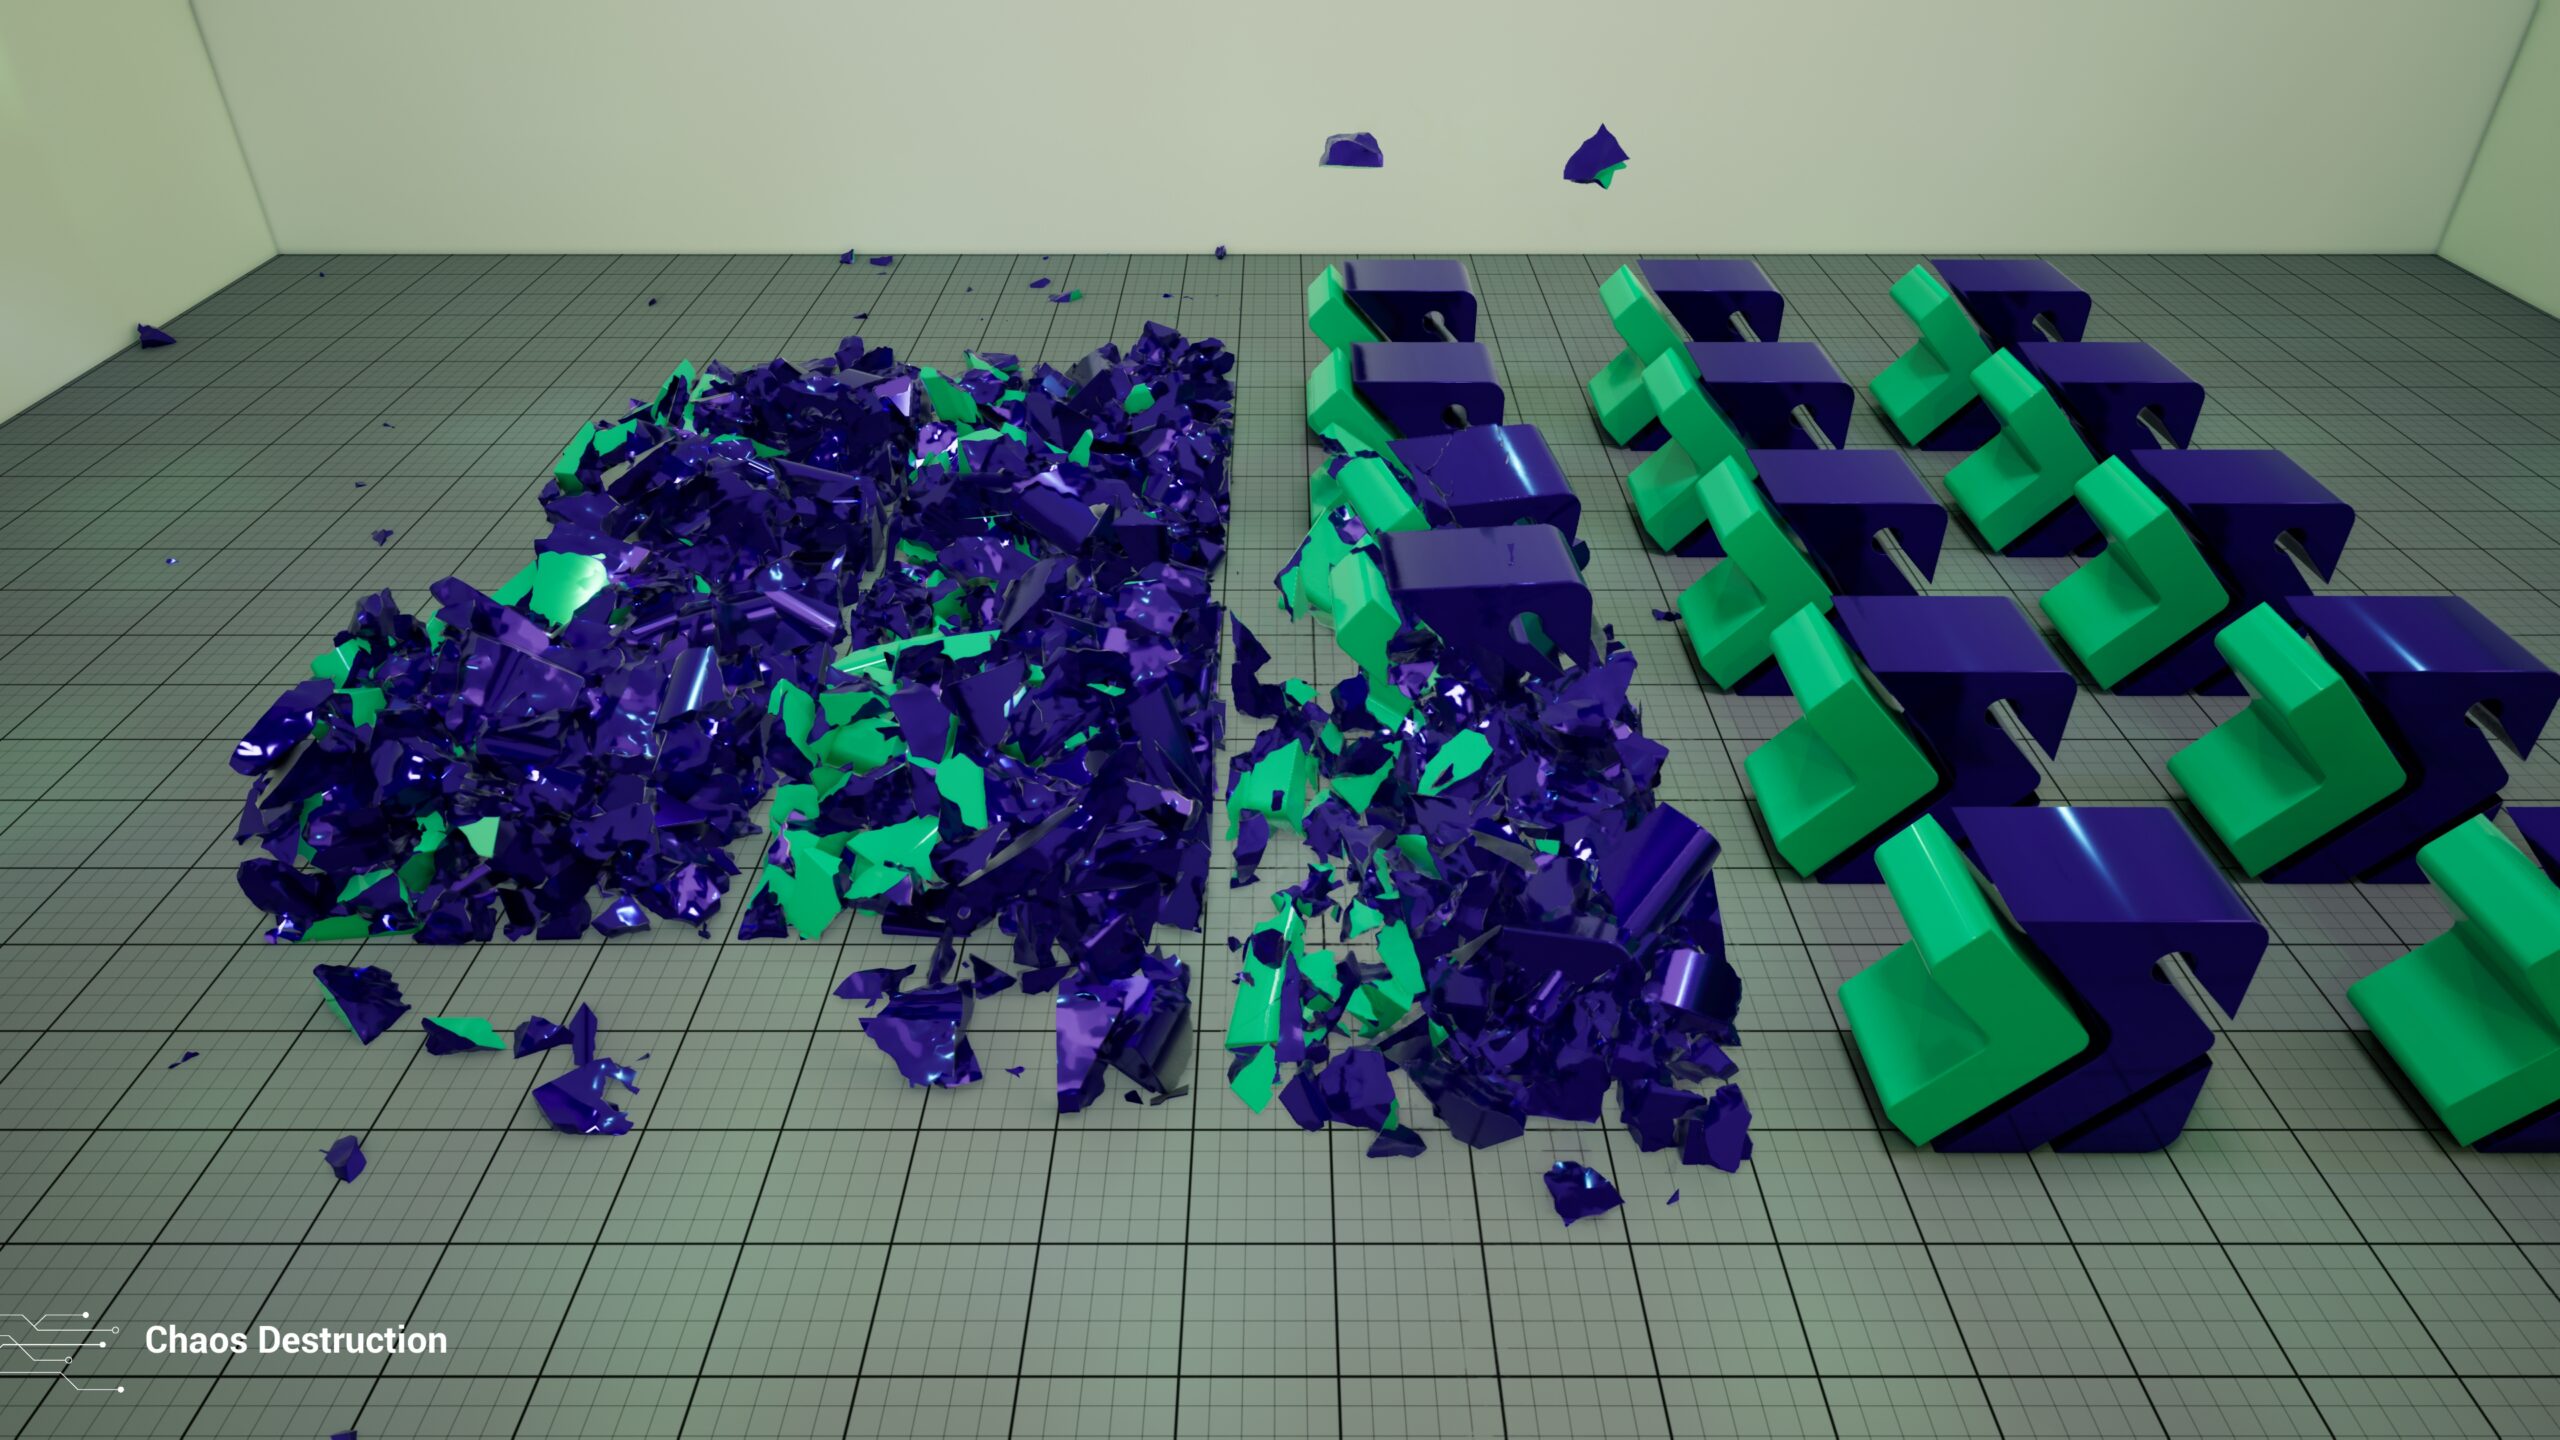
| Chaos Destruction | Extended | CPU | The Chaos Destruction Test evaluates Unreal Engine’s Chaos destruction system using 25 Geometry Collections arranged in five columns. All destructible objects are active at the start of the simulation, with fracture events triggered by a manually animated sphere impacting each column sequentially over a 30-second period. Each Geometry Collection uses multiple fracture levels, ranging from an intact root object (1 bone/1 convex), to uniformly fractured pieces (39 bones/39 convex), and clustered fracture structures (413 bones/413 convex). |

Niagara Simulation
The Niagara Simulation tests are designed to measure the performance of various aspects of Niagara – Unreal Engine’s VFX system. Niagara tends to be heavily GPU-accelerated and can benefit greatly from a powerful GPU.
Performance for these tests is measured in a floating editor viewport set to 1920×1080. Tests are run for 30 seconds, with an additional 2 seconds of unrecorded buffer at the end to allow Unreal Engine to safely tear down the window. The benchmark calculates FPS by measuring the time between each game tick during the run, converting each interval into an FPS value, and then averaging those values together.
| Test Name | Benchmark Preset | Processing Type | Description |
|---|---|---|---|
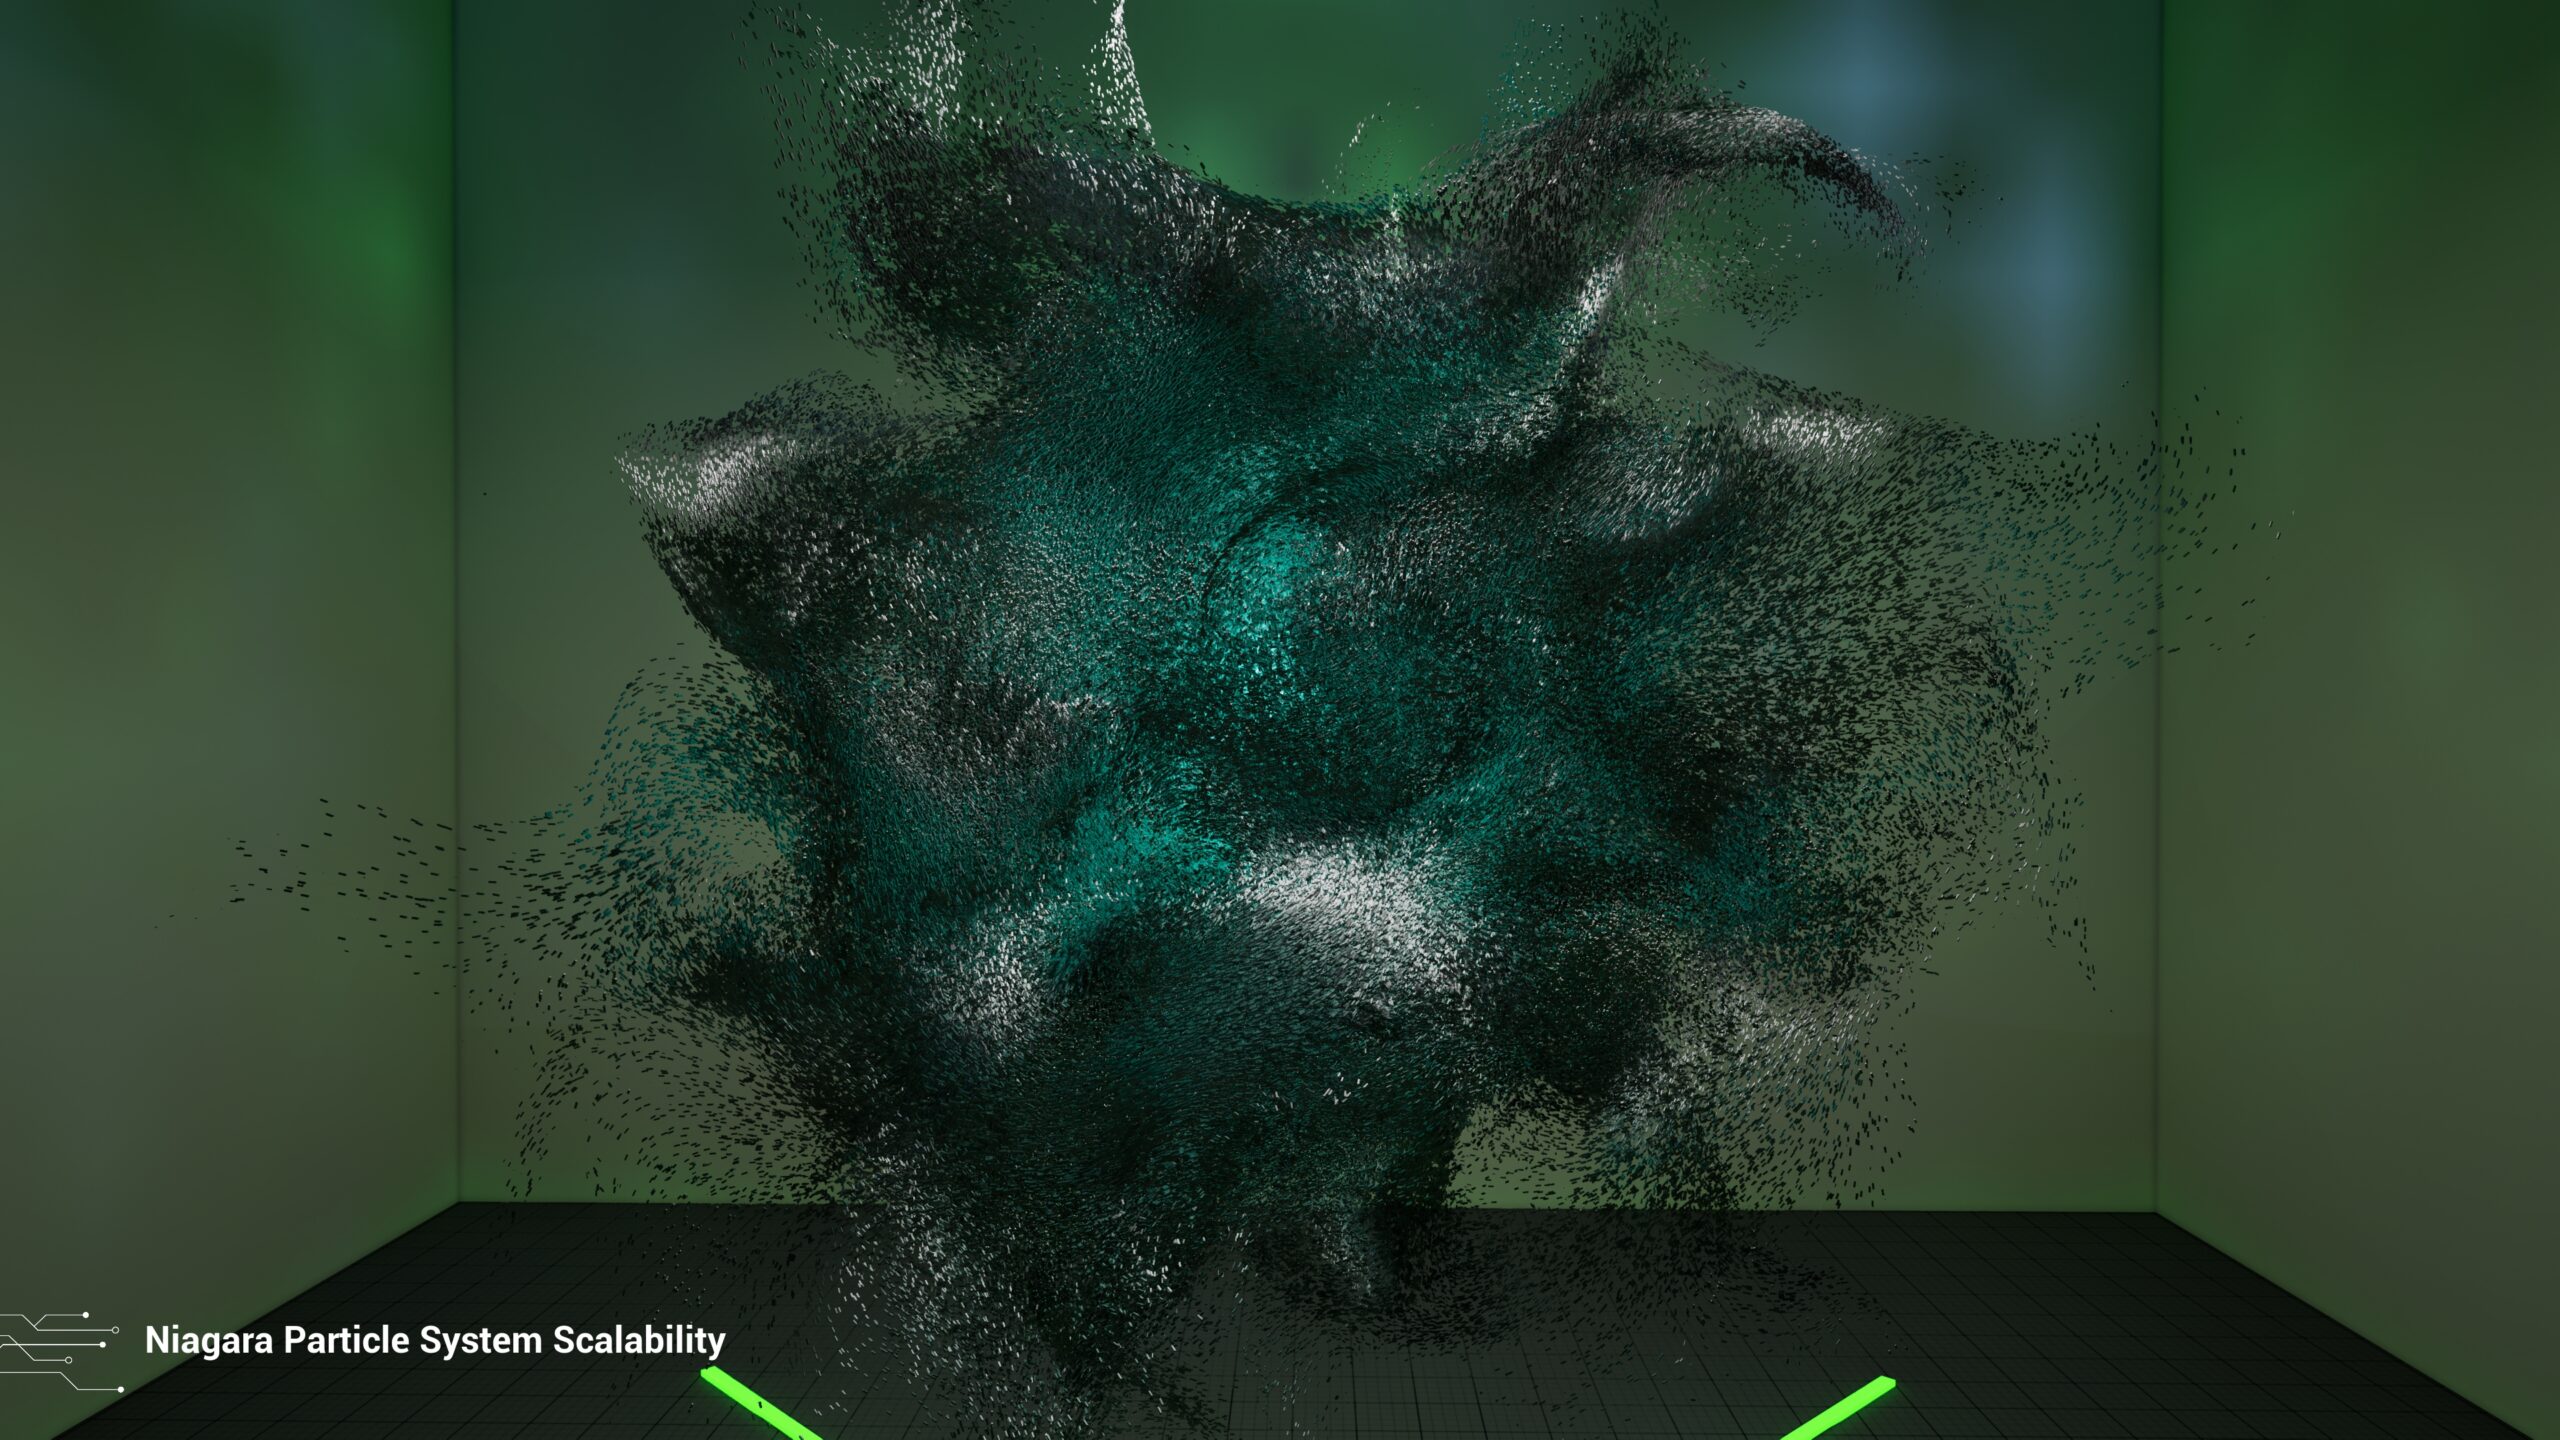
| Niagara Particle Scalability | Standard, Extended | GPU | The Niagara Particle Scalability Test evaluates Unreal Engine’s Niagara particle simulation and rendering performance using a large-scale particle system with approximately 750k active particles. The test uses a GPU particle simulation with a high spawn rate of 148k particles per second and a 5-second lifetime, maintaining a sustained particle workload throughout the benchmark. |
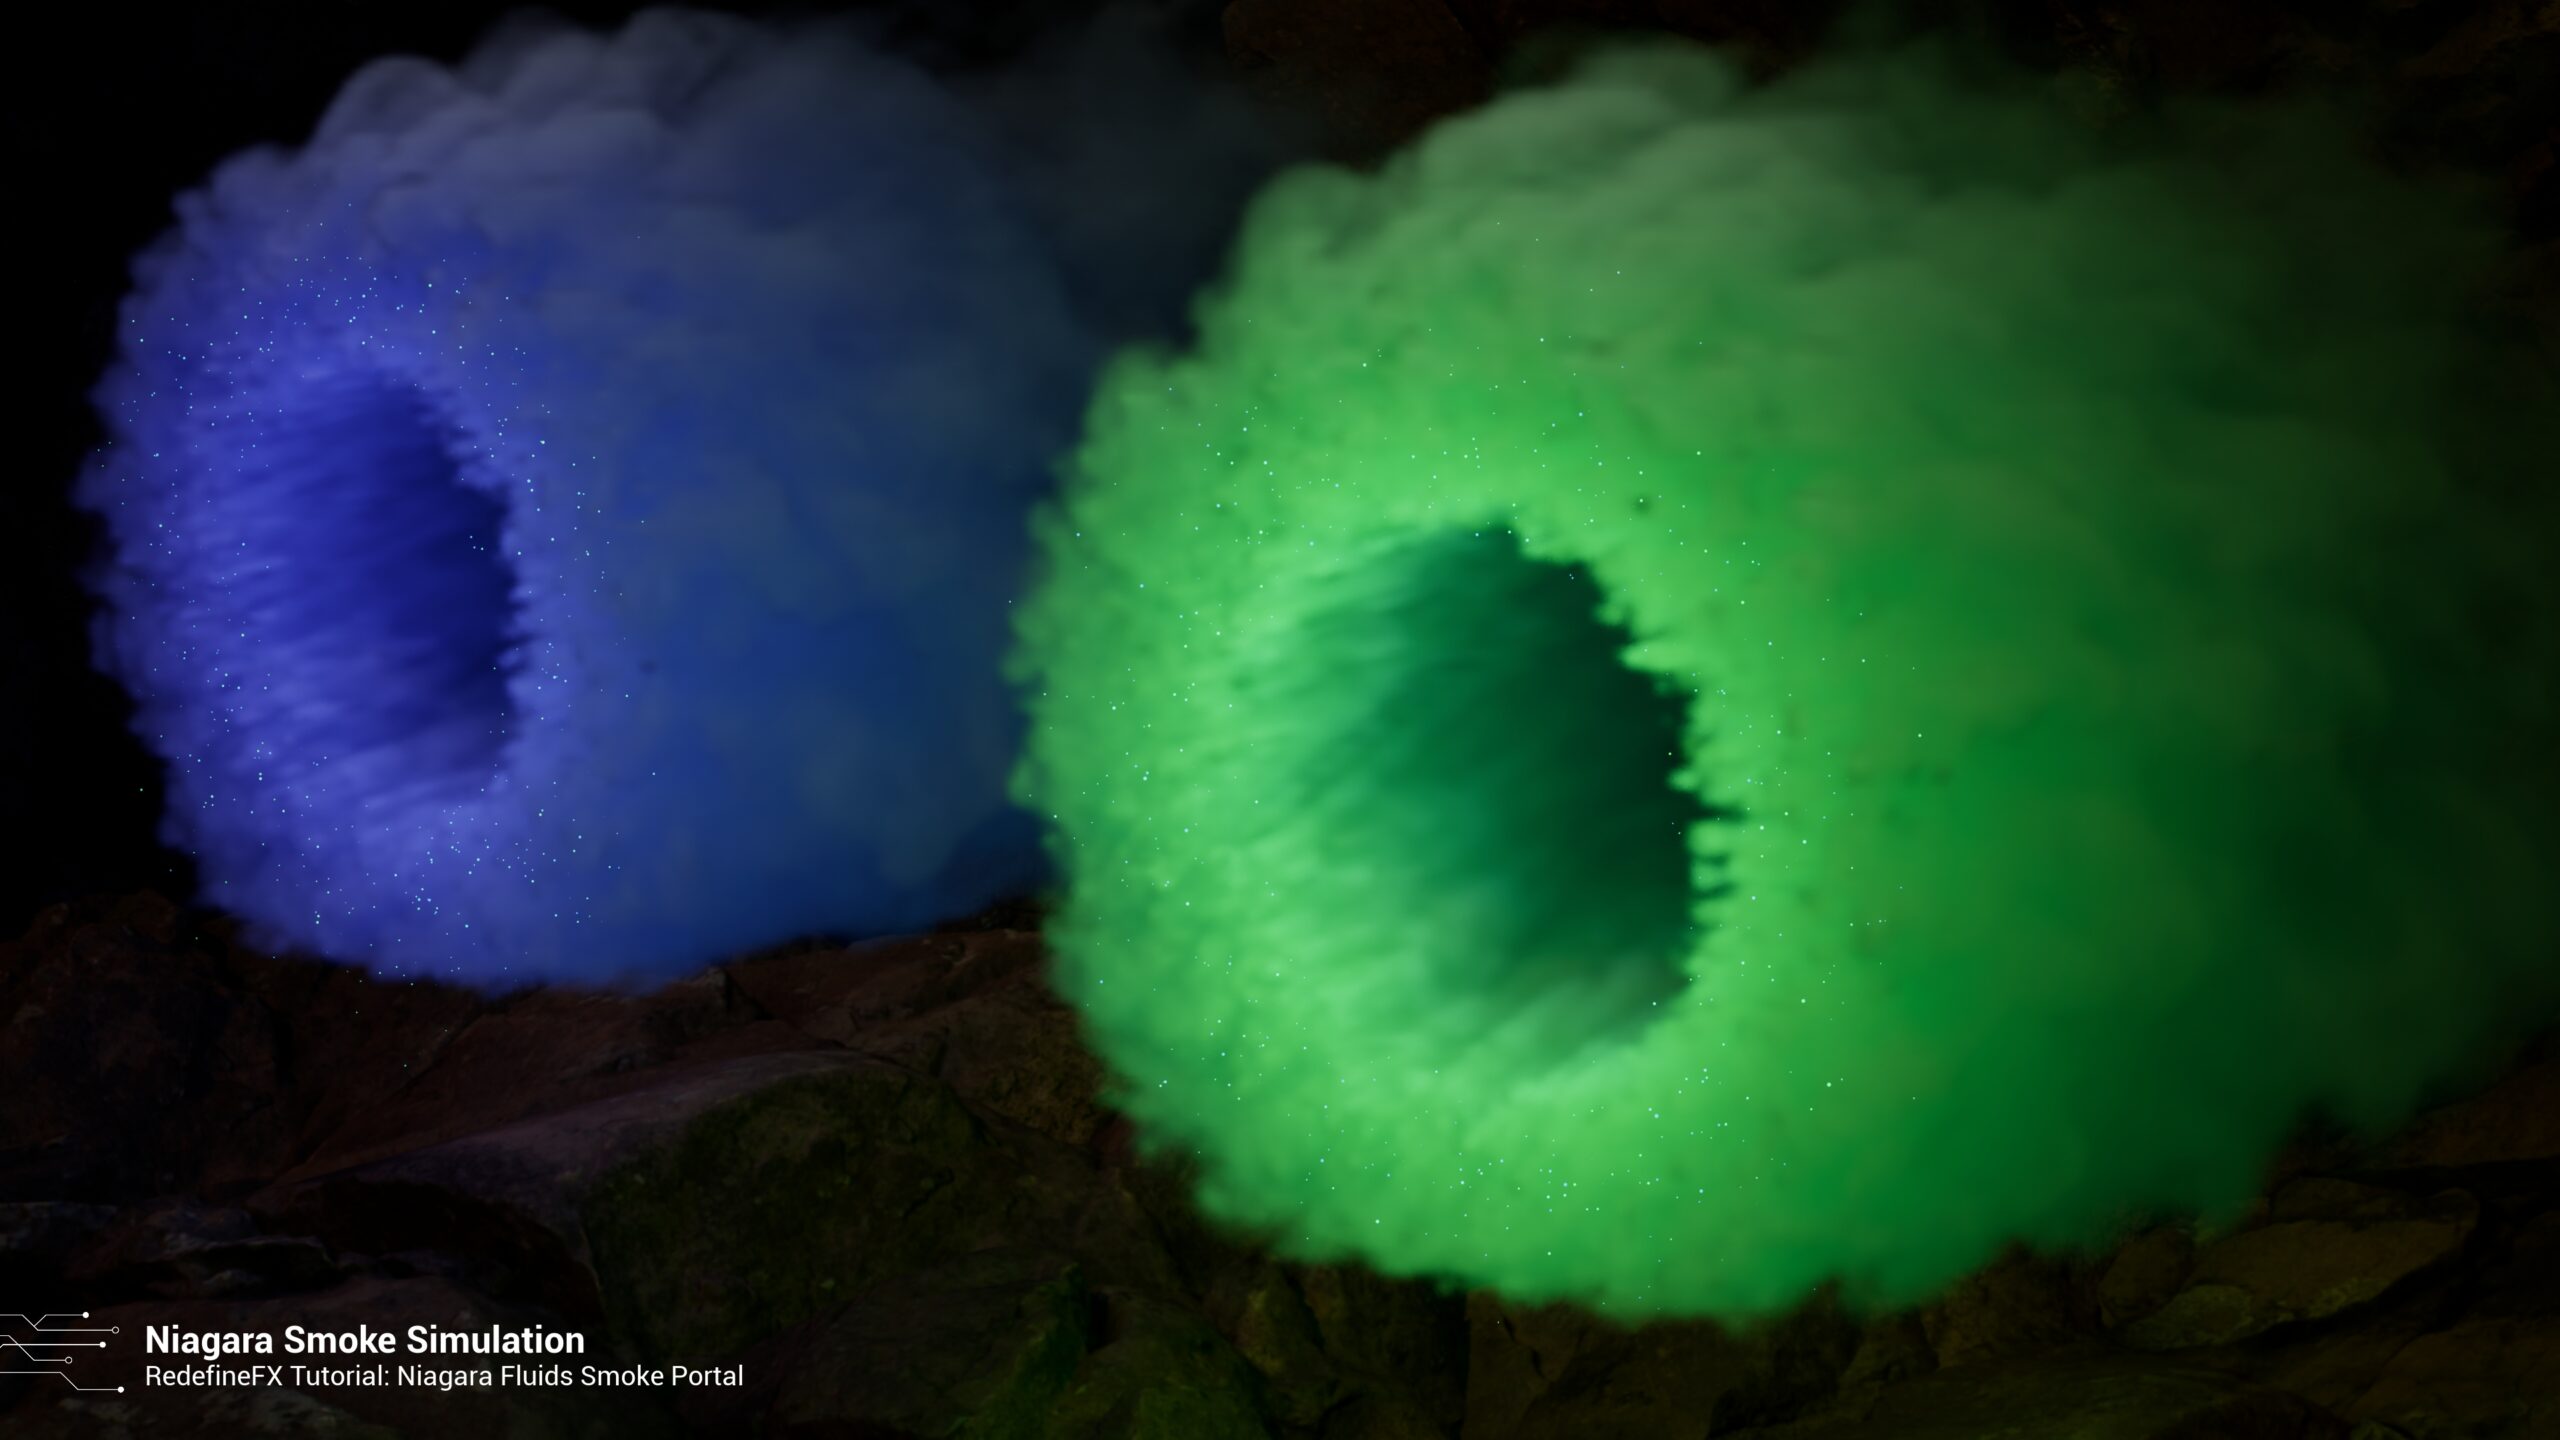
| Niagara Smoke | Standard, Extended | GPU | Based on RedefineFX tutorial: Niagara Fluids Smoke Portal VFX Tutorial in Unreal Engine 5 | Real-Time Simulation The Niagara Smoke Test evaluates Unreal Engine’s Niagara GPU simulation and volumetric rendering performance using two instances of a portal-based smoke effect. Each portal uses a Grid3D gas simulation running on the GPU compute pipeline, with a simulation volume of 1200 × 1200 × 600 units and a maximum grid resolution of 250 along the largest axis. The simulation uses six pressure solver iterations and gravity to drive smoke movement, with additional particle emitters controlling gas behavior and adding visual effects. |
| Niagara Water | Extended | GPU | The Niagara Water Simulation Test evaluates Epic’s Niagara Fluids simulation performance using a FLIP-based water system. A rotating paddle continuously disturbs a simulated water pool, generating surface motion and froth through fluid-particle interactions. The Niagara system runs on the GPU compute pipeline and maintains millions of simulated particles across primary and secondary FLIP emitters. Note: Niagara Fluids is currently in Beta. |


Asset and Scene Initialization, Movie Render, and Editor Runtime
The Asset and Scene Initialization, Movie Render, and Editor Runtime tests are run on a number of levels that feature a range of different actors, assets, and environments.
Asset and Scene Initialization
When a level is opened for the first time on a system, it can take time to prepare textures, static meshes, shaders, etc. These tests measure how long it takes for Unreal Engine to perform these steps.
Render Movie
The Render Movie tests use the Unreal Engine Movie Render Queue, with a base Movie Render Graph that exposes variables to configure settings such as resolution, frame range, output directory, etc. Tests are run with two different renderers: Deferred Renderer (default) and Path Traced Renderer.
Before each test, a quick warm-up render is performed in order to ensure that no additional shaders need to be compiled. At the end of the test, the render time is pulled directly from the Unreal Engine log file (“LogMovieRenderPipeline: Movie Graph Render completed. Duration:“) to minimize the render startup and cleanup time from influencing the results. The benchmark calculates FPS by taking the number of frames rendered and dividing it by the total render time reported by the log file.
The number of frames that are rendered varies based on the level of complexity, with a target of around 30-60 seconds render time on a high-end workstation.
Editor Runtime
The Editor Runtime tests measure performance in the editor viewport. For consistency, playback is done in a new window with the processing resolution set to either HD (1920×1080) or UHD (3840×2160), then scaled down to fit on the display (scaling has a minimal impact on performance). Tests are run for 30 seconds, with an additional 2 seconds of un-recorded buffer at the end to allow Unreal Engine to safely tear down the window.
The benchmark calculates FPS by measuring the time between each game tick during the run, converting each interval into an FPS value, and then averaging those values together.
Level Descriptions
| Test Name | Initialization Preset | Movie Render Preset | Editor Runtime Preset | Description |
|---|---|---|---|---|
| PCG Forest | Standard, Extended | Standard (HD), Extended (HD/UHD) | Standard (HD), Extended (HD/UHD) | The PCG Forest level is a procedurally generated forest environment created with Unreal Engine 5.8 PCG (Procedural Content Generation) and PVE (Procedural Vegetation Editor) systems. The scene distributes more than 405k environment instances across a landscape using procedural placement rules, including vegetation, rocks, and natural debris. All meshes use Nanite, with vegetation assets utilizing wind-driven vertex animation. |
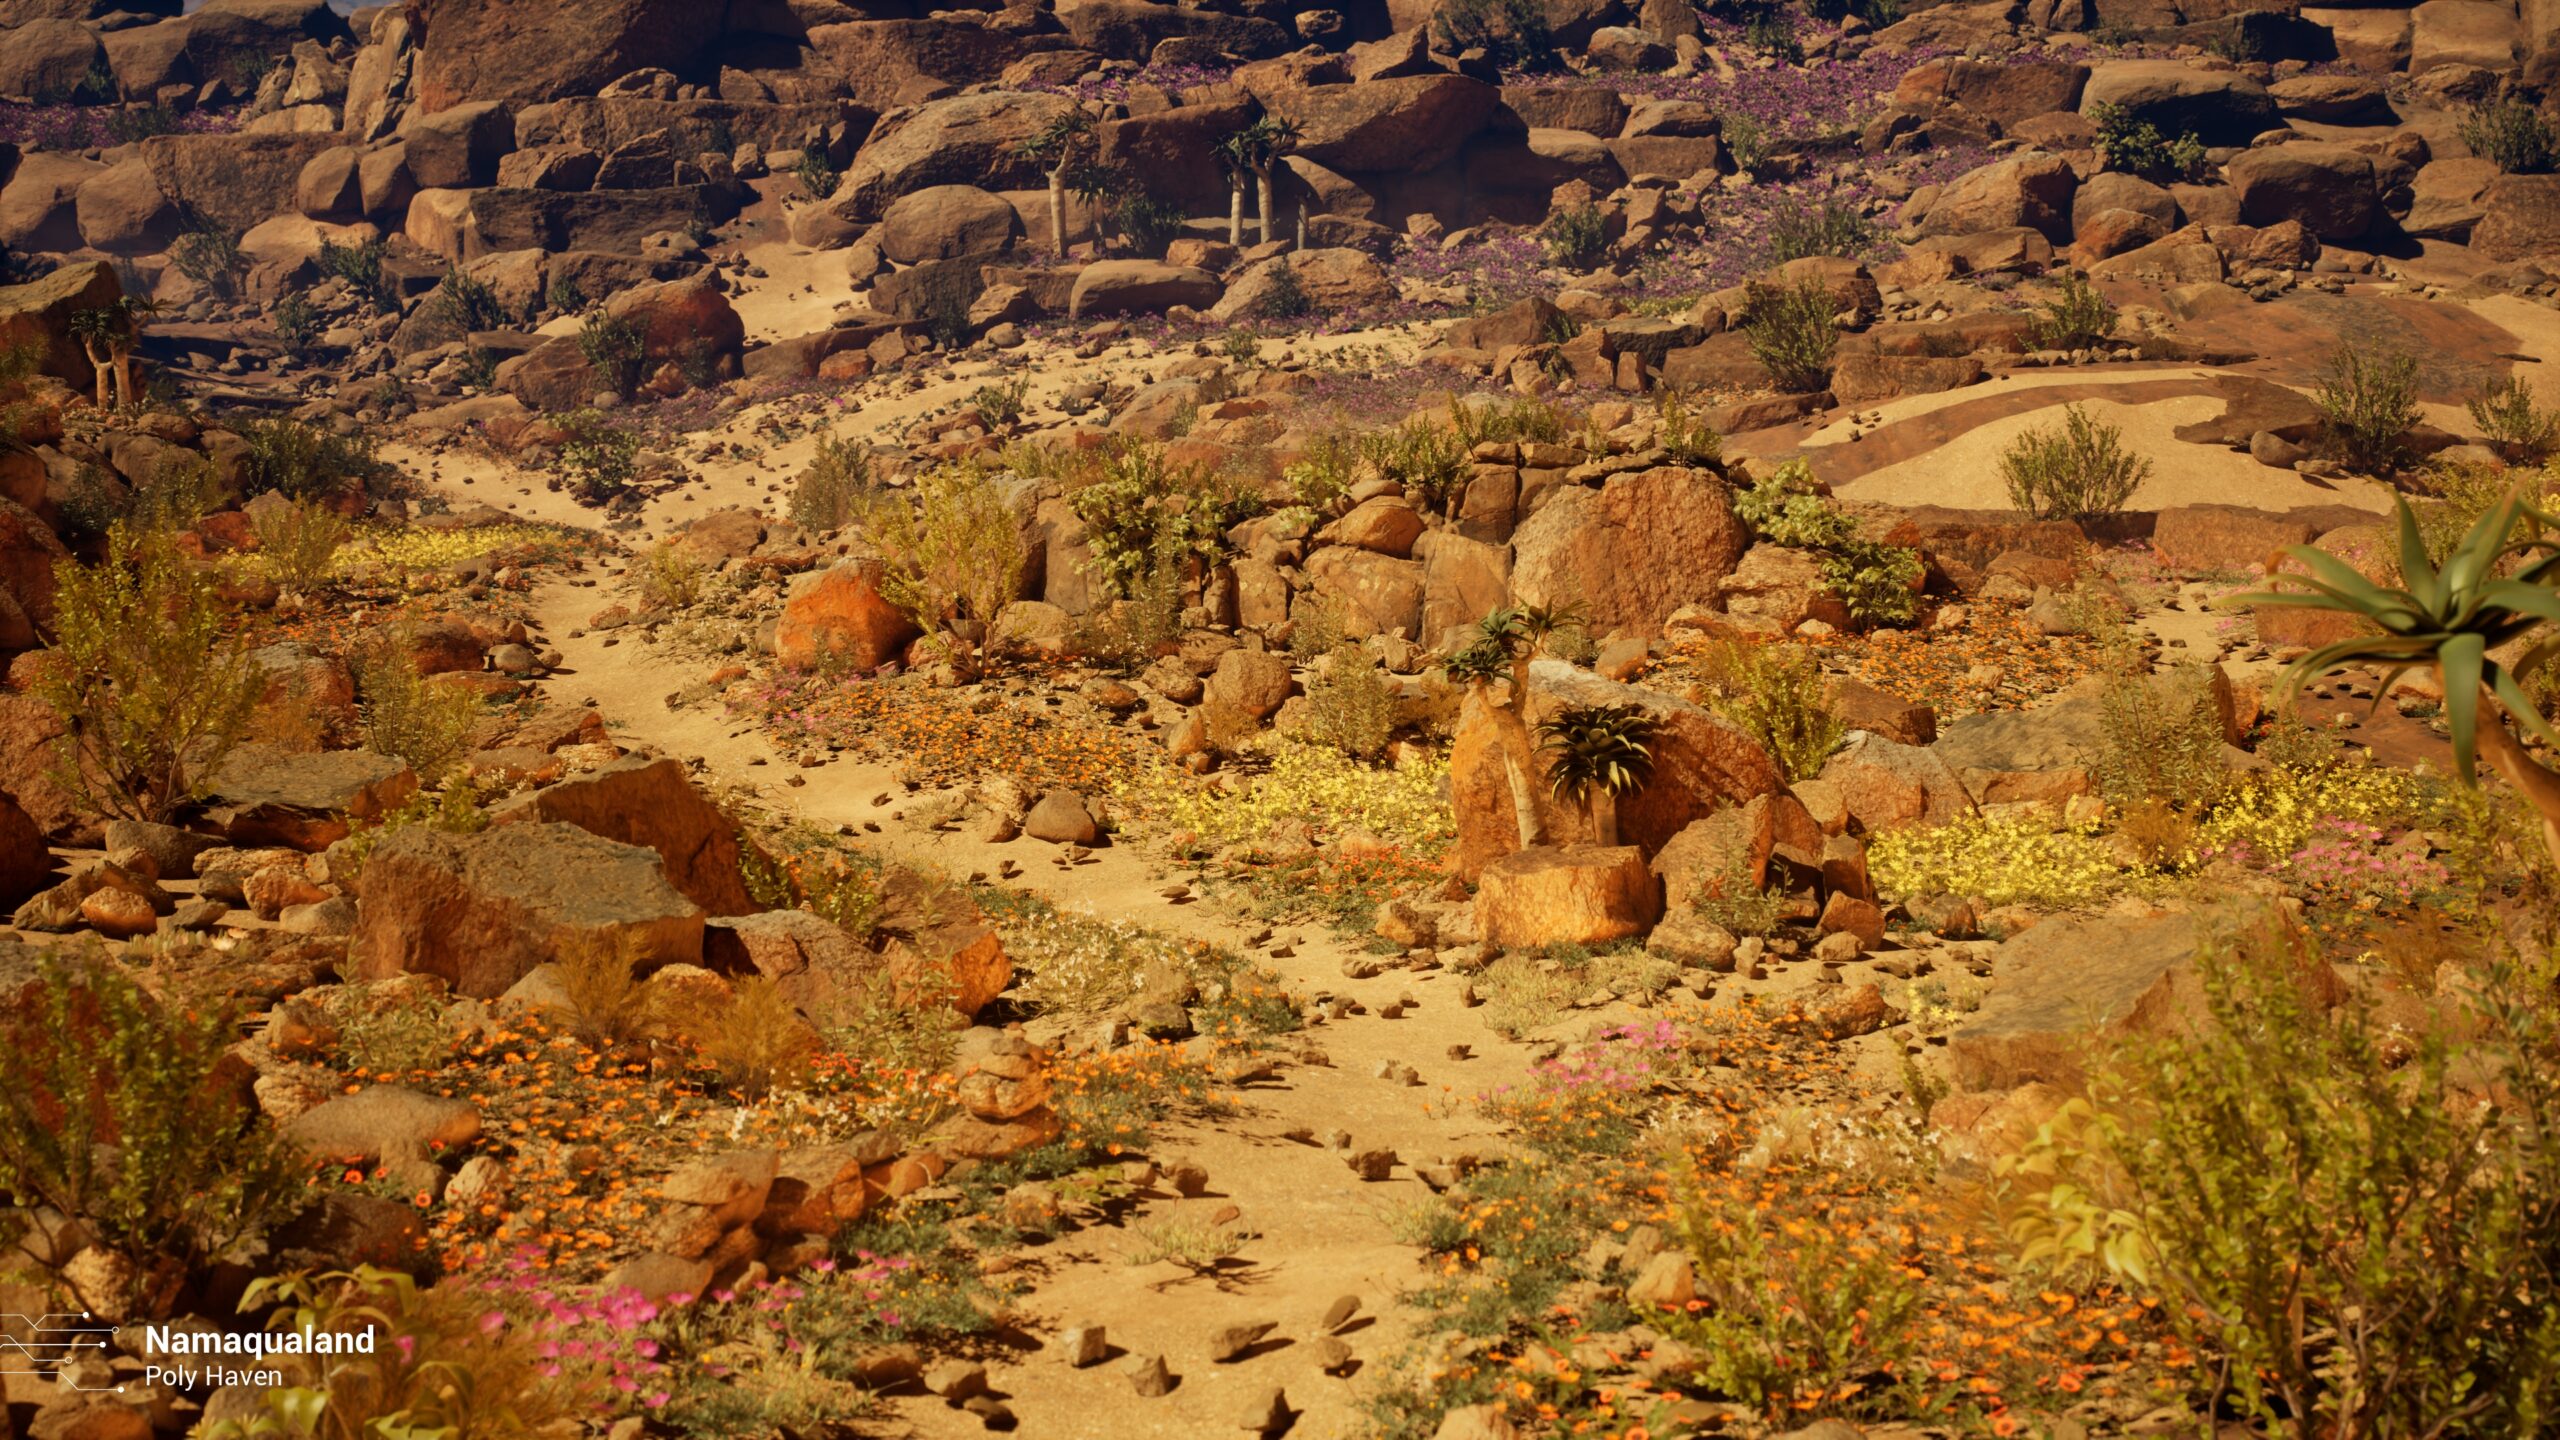
| Namaqualand | Standard, Extended | Standard (HD), Extended (HD/UHD) | Standard (HD), Extended (HD/UHD) | Source: Poly Haven Collection: Namaqualand License: CC0 The Namaqualand level is a large-scale photorealistic outdoor environment created from Poly Haven’s Namaqualand asset collection. The scene represents a rocky South African desert landscape populated with scanned vegetation, rocks, terrain elements, and natural environmental details. |
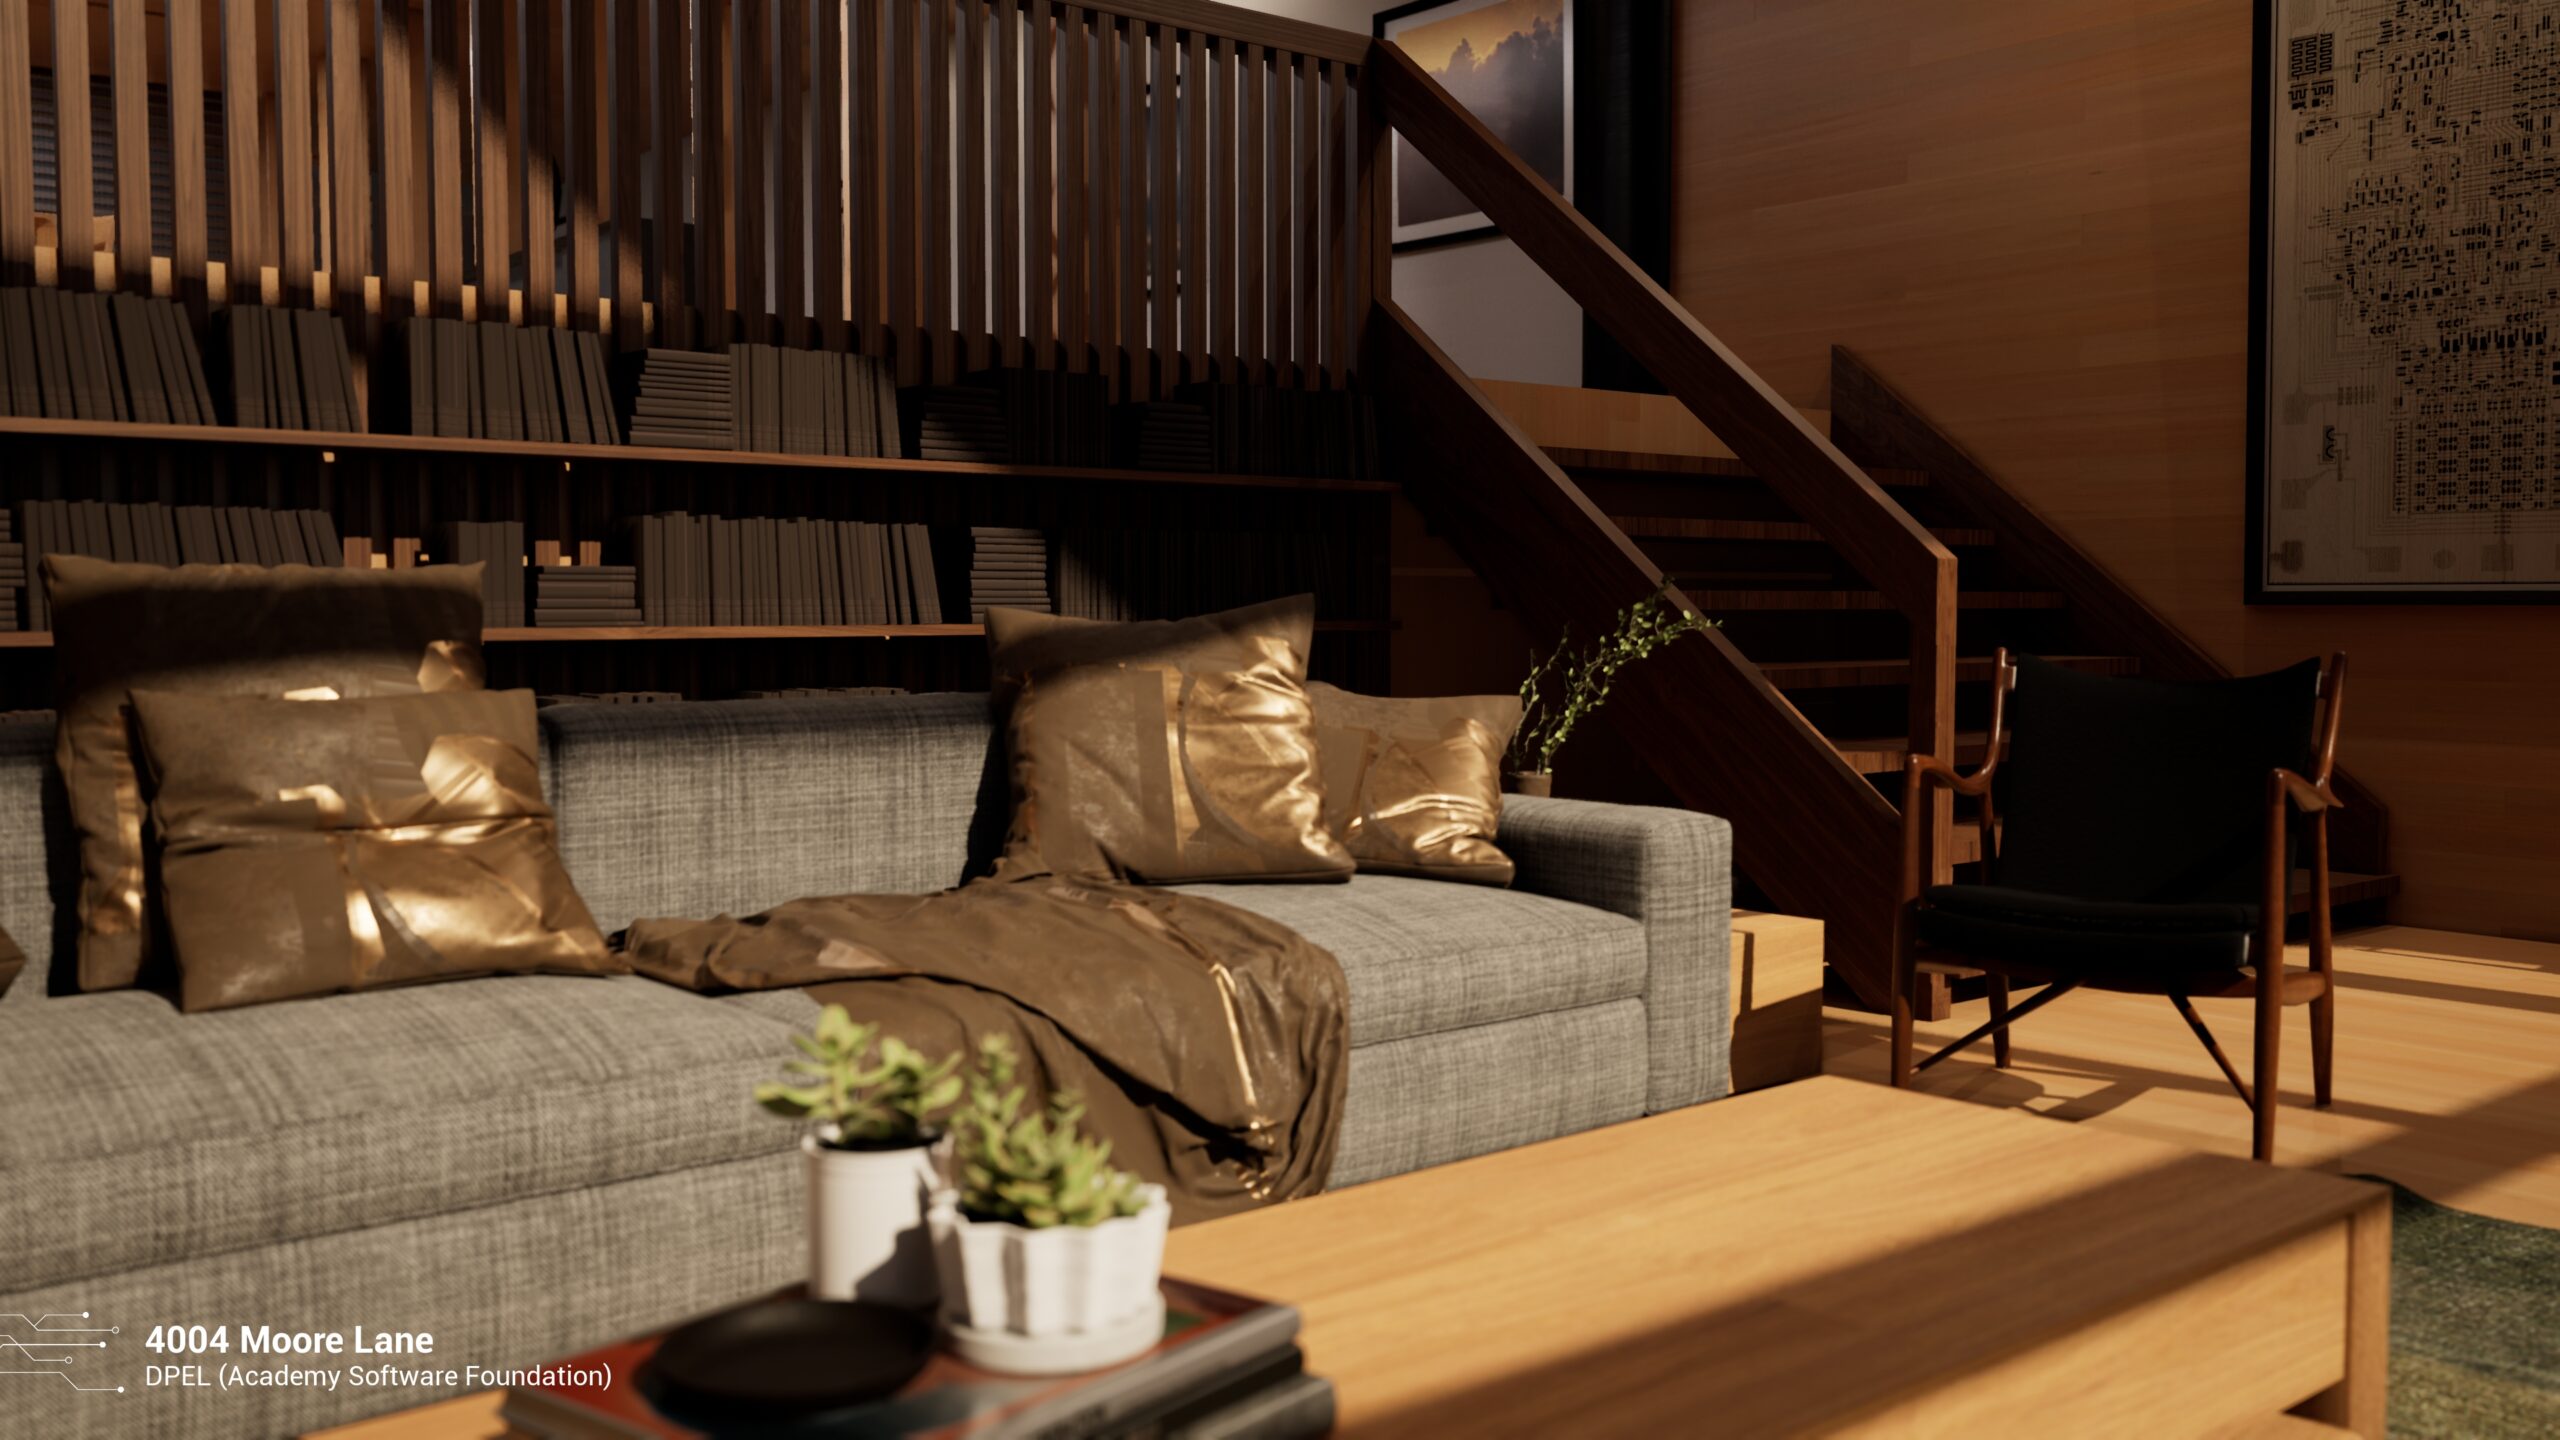
| 4004 Moore Lane | N/A | Extended (UHD/UHD Path Traced) | Extended (HD/UHD) | Source: DPEL (Digital Production Example Library), Academy Software Foundation License: ASWF Digital Assets License v1.1 The 4004 Moore Lane level uses the 4004 Moore Lane USD scene created by Intel and distributed by the Digital Production Example Library (DPEL). The scene represents a fully composed architectural environment designed to explore challenges in modern rendering workflows, including complex lighting, material evaluation, and scene organization. The original USD asset was imported into Unreal Engine and converted into native Unreal assets. Alterations: – Replaced Sun DirectionalLight and HDRI Skylight with Unreal Engine DirectionalLight, ExponentialHeightFog, SkyAtmosphere, SkyLight, SkySphere, and VolumetricCloud – Converted from USD to Static Meshes, Textures, and Materials – Enabled Nanite on all meshes – Enabled Megalight support – Replaced water texture – Replaced glass textures – Created a new Level Sequence |
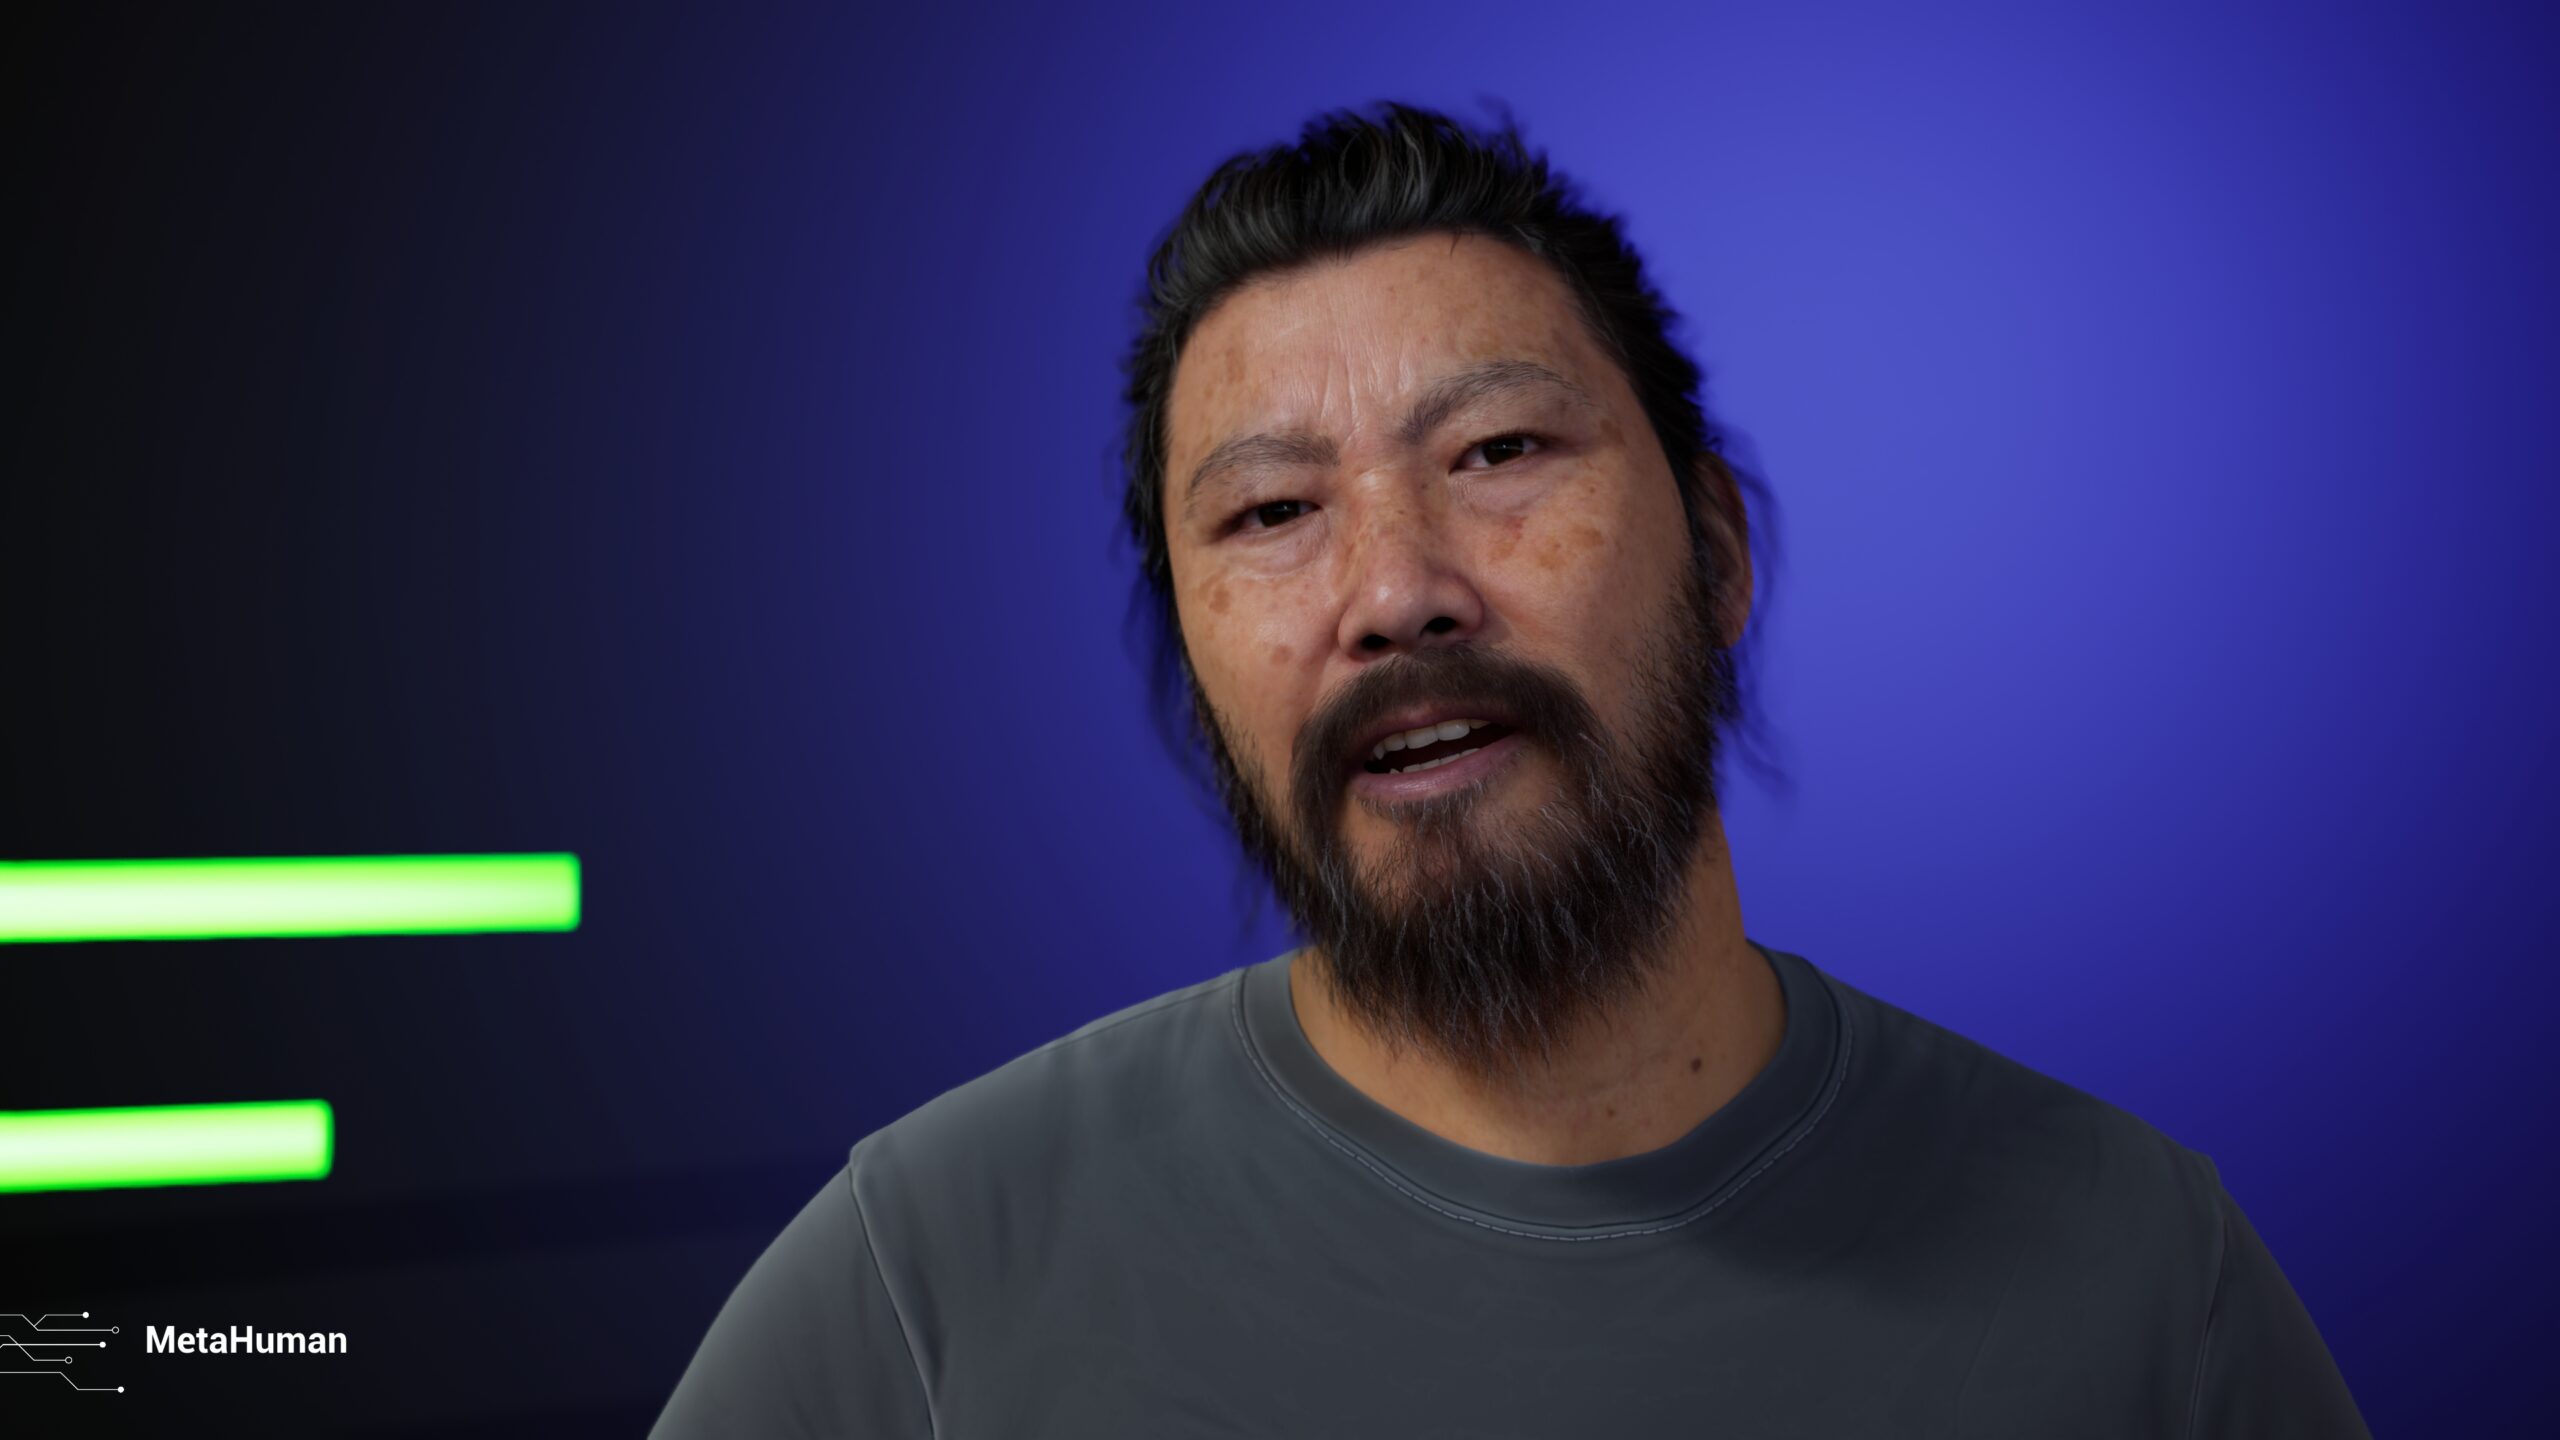
| MetaHuman | N/A | N/A | Extended (HD/UHD) | The MetaHuman level uses a high-quality MetaHuman character driven by facial animation captured from video. The scene stresses real-time character rendering through skeletal animation, facial deformation, groom-based hair rendering, complex materials, and animation playback. |





How Does the Scoring Work?
All of the scores in our Unreal Engine benchmark are calculated using geometric means rather than averages or performance relative to a reference result. This helps to normalize the scores so that larger or smaller results are not unfairly weighted. It also allows for the benchmark to be more flexible and better able to handle large performance shifts due to either application optimizations or the launch of more powerful hardware.
Since our scores are based on a “Higher is Better” method, any result in seconds is converted to the performance rate (higher is better) by dividing 1 by the result (example: 1/1.17 = .855).
For the actual score calculations, we start by grouping the tests by type – generating a score for each group by taking the geometric mean of the results. This score is then used to calculate the Overall Score.
Major Scores
The tests are divided by category (Compile Shaders, Chaos Simulation, Niagara Simulation, Asset and Scene Initialization, Movie Render, Editor Runtime) with a score calculated based on the geomean of each test within that group. Each score is multiplied by a different scoring coefficient to bring the scores across all our benchmarks roughly in line with each other.
Compile Shaders Score = geomean (1/Compile test1) * 30000  Note: Compile Shaders only has a single test
Chaos Simulation Score = geomean (Chaos test1, Chaos test2, ...) * 3.0
Niagara Simulation Score = geomean (Niagara test1, Niagara test2, ...) * 3.0
Asset and Scene Initialization Score = geomean (1/Initialization test1, 1/Initialization test2, ...) * 6500
Movie Render Score = geomean (Render test1, Render test2, ...) * 7.5
Editor Runtime Score = geomean (Runtime test1, Runtime test2, ...) * 3.5
Overall Score
These major scores are then combined into the Overall Score using a geometric mean and multiplied by 100 to differentiate the Overall Score from the Major Scores. Currently, we do not weigh any of the major scores more than any of the others, so each contributes equally to the Overall Score.
Overall Score = geomean (Compile Shaders Score, Chaos Simulation Score, Niagara Simulation Score, Asset and Scene Initialization Score, Movie Render Score, Editor Runtime Score) * 100This method results in an Overall Score with a typical run-to-run variance of about 1-2% and Major Scores with a variance of about 5%, assuming there is no thermal or other performance throttling occurring on the system.
Benchmark Groups
Results in the Puget Bench public benchmark database are grouped according to the benchmark and application version in order to maintain a balance of performance consistency and sample size. For example, if we are forced to change our benchmark to add, remove, or change a test, we do not want to group the results with those from a different benchmark version. More commonly, however, is that there is a change in the host application (Unreal Engine, Photoshop, etc.) that affects performance. This could be an update that improves GPU usage or changes how effects are processed, which can throw off comparisons with prior results.
At the same time, we try not to split results into too many small groups. Having more results in each group makes the data more useful – it smooths out odd scores and gives you a better idea of how different hardware stacks up.
Currently, for Unreal Engine, we have the following score groups:
None while Puget Bench for Unreal Engine is in Beta
Benchmark Update Log
None while Puget Bench for Unreal Engine is in Beta
Beta Benchmark Branch
In addition to the main benchmark versions, licensed users also have access to a beta branch. This is where we trial tests, often to take advantage of new features added to the base applications. Beta branches are also where we add preliminary support for beta versions of Unreal Engine.
These benchmark builds may include different tests and can have differences in how the scoring is calculated, so we recommend reading the update notes carefully to see if they can be used alongside the release versions of the benchmark.
Current notes on the beta branch:
Version 0.1.0-beta
- Initial public beta release