Table of Contents
Introduction
A few weeks ago, Intel announced a refresh to its popular Core Ultra 200S product line, with two new CPU models: the Intel Core™ Ultra 7 270K Plus and the Core™ Ultra 5 250K Plus. This represents something of a sea change in Intel’s product strategy from generations past. Whereas refreshes used to push the top-end halo product (for example, with the Core™ i9 14900KS) by modestly bumping frequencies, this update to the Arrow Lake family instead reworks the lower-end SKUs, and in a significant way.

Intel’s Core Ultra 200S processors are likely well-known by most who follow the PC component space. Although they weren’t the fastest option for gamers, they have offered outstanding performance across a wide variety of professional workflows and applications driven by their compelling combination of cores, clocks, and iGPU. These Arrow Lake processors are hybrid CPUs, incorporating high-performance P-cores and more efficient E-cores (based on the Lion Cove and Skymont microarchitectures, respectively).
With this refresh, Intel is positioning the new 250K Plus as a direct replacement for the 245K, and the 270K Plus as a replacement for the 265K. The most obvious changes with these models, relative to their progenitors, are that Intel has increased the number of E-cores by four, the E-core max boost by 100 MHz, and maximum memory speeds from 6400 to 7200.
Those are substantial changes, bringing the 270K Plus’ specs on paper up to almost match the top-end 285K – but they aren’t the only ones! Intel has also worked to address memory-latency issues that caused performance regression in gaming with the launch of Arrow Lake-S by increasing the speed of their die-to-die interconnect from 2.1 to 3 GHz. Aside from the additional cores, the other changes could theoretically have been achieved by overclocking the previous models. Since we look exclusively at stock performance, due to our focus on reliability in professional applications, seeing Intel validate and implement these capabilities is great.
While these processors are drop-in replacements for current Arrow Lake CPUs, we expect that few end-users already on Core Ultra would feel the need to upgrade; it is more likely that these will interest users looking to migrate from an older platform. That being said, anyone who does choose to purchase one of these new CPUs as an upgrade should look out for two new pieces of software from Intel. First, their iPPP should simplify driver installation by bundling together a few of their drivers and software packages, such as IPF, DTT, PPM, APO, and their new iBOT. Don’t worry if you don’t know what all of those stand for, as most are set and forget. The exception is the APO and iBOT, the latter of which is new and can optimize certain games to run on these Intel CPUs. We won’t be looking at that in this article, but we are confident many other reviewers will cover it within more gaming-centric content. We do appreciate the one-stop nature of installing nearly all necessary drivers through one package (except iGPU and NPU).
Specifications
| wdt_ID | wdt_created_by | wdt_created_at | wdt_last_edited_by | wdt_last_edited_at | CPU Model | Price | L3 Cache | L2 Cache | P-Cores | E-Cores | Threads | Maximum Boost Clock | E-Core Boost Clock | Default PPT |
|---|---|---|---|---|---|---|---|---|---|---|---|---|---|---|
| 1 | Evan | Mar 2026 01:31 PM | Evan | Mar 2026 01:31 PM | AMD Ryzen 9 9950X3D | 700 | 128 | 16 | 16 | 32 | 5.70 | 200 | ||
| 2 | Evan | Mar 2026 01:31 PM | Evan | Mar 2026 01:31 PM | AMD Ryzen 9 9950X | 550 | 64 | 16 | 16 | 32 | 5.70 | 200 | ||
| 3 | Evan | Mar 2026 01:31 PM | Evan | Mar 2026 01:31 PM | Amd Ryzen 9 9900X3D | 600 | 128 | 12 | 12 | 24 | 5.70 | 162 | ||
| 4 | Evan | Mar 2026 01:31 PM | Evan | Mar 2026 01:31 PM | AMD Ryzen 9 9900X | 440 | 64 | 12 | 12 | 24 | 5.60 | 162 | ||
| 5 | Evan | Mar 2026 01:31 PM | Evan | Mar 2026 01:31 PM | AMD Ryzen 7 9850X3D | 500 | 96 | 8 | 8 | 16 | 5.60 | 162 | ||
| 6 | Evan | Mar 2026 01:31 PM | Evan | Mar 2026 01:31 PM | AMD Ryzen 7 9800X3D | 480 | 96 | 8 | 8 | 16 | 5.20 | 162 | ||
| 7 | Evan | Mar 2026 01:31 PM | Evan | Mar 2026 01:31 PM | AMD Ryzen 7 9700X | 340 | 32 | 8 | 8 | 16 | 5.50 | 88 | ||
| 8 | Evan | Mar 2026 01:31 PM | Evan | Mar 2026 01:31 PM | AMD Ryzen 5 9600X | 220 | 32 | 6 | 6 | 12 | 5.40 | 88 | ||
| 9 | Evan | Mar 2026 01:31 PM | Evan | Mar 2026 01:51 PM | Intel Core Ultra 9 285K | 580 | 36 | 40 | 8 | 16 | 24 | 5.70 | 4.60 | 250 |
| 10 | Evan | Mar 2026 01:31 PM | Evan | Mar 2026 01:50 PM | Intel Core Ultra 7 270K Plus | 300 | 36 | 40 | 8 | 16 | 24 | 5.50 | 4.70 | 250 |
| 11 | Evan | Mar 2026 01:31 PM | Evan | Mar 2026 01:50 PM | Intel Core Ultra 7 265K | 290 | 30 | 36 | 8 | 12 | 20 | 5.50 | 4.60 | 250 |
| 12 | Evan | Mar 2026 01:31 PM | Evan | Mar 2026 01:50 PM | Intel Core Ultra 5 250K Plus | 200 | 30 | 30 | 6 | 12 | 18 | 5.30 | 4.70 | 159 |
| 13 | Evan | Mar 2026 01:31 PM | Evan | Mar 2026 01:49 PM | Intel Core Ultra 5 245K | 200 | 24 | 26 | 6 | 8 | 14 | 5.30 | 4.60 | 159 |
The most exciting part of this launch, from our perspective, is the price. Previously, the 8P+16E core configuration was only available with a Core™ Ultra 285K – priced at around $580. That same core layout is now available in the 270K Plus for only $300. Although there are still some minor cock speed differences, Intel is essentially putting the 285K on a fire sale at nearly half off! Similarly, while the 250K Plus isn’t quite a core-for-core match to the 265K, it is very close – and costs $100 less.
Otherwise, the spec differences are largely as we covered above. The 250K Plus offers 4 more E-cores over the 245K, and a higher E-core boost, but is otherwise the same. Similarly, 270K Plus offers 4 more E-cores over the 265K and a higher E-core boost for $10 more (though we suspect street pricing may shift some). The 270K Plus is therefore nearly a 285K, but with a lower P-core max boost and higher E-core max boost.
Comparing to AMD has become increasingly difficult as they have very different CPU designs, but based on cost, the 270K Plus is positioned to undercut the Ryzen™ 7 9700X by about $40, depending on the current sale/street price. From Intel’s new offering, users will get the same number of P cores as well as “bonus” E cores, with the P-cores having a similar boost. The 270K Plus also offers more L3 Cache – and far more L2 cache – though it also draws a lot more power. On paper, that is a favorable comparison for Intel. The 250K Plus is positioned about $20 below the 9600X and again offers the same number of performance cores while also including E-cores and more cache overall, again with a much higher power budget.
Test Setup (Expandable)
AMD Ryzen Test Platform
| CPUs: AMD Ryzen™ 9 9950X3D AMD Ryzen™ 9 9900X3D AMD Ryzen™ 7 9850X3D AMD Ryzen™ 7 9700X |
| CPU Cooler: Noctua NH-U12A |
| Motherboard: ASUS ProArt X670E-Creator WiFi BIOS Version: 3513 |
| RAM: 2x DDR5-5600 32GB (64 GB total) |
| GPUs: NVIDIA GeForce RTX™ 5080 Driver Version: 591.74 |
| PSU: EVGA SuperNOVA 1200W P2 |
| Storage: Kingston KC3000 2TB |
| OS: Windows 11 Pro 64-bit (26200) Power Profile: Balanced |
Intel Core Ultra Test Platform
| CPUs: Intel Core™ Ultra 7 270K Plus Intel Core™ Ultra 5 250K Plus Intel Core™ Ultra 9 285K Intel Core™ Ultra 7 265K Intel Core™ Ultra 5 245K |
| CPU Cooler: Noctua NH-U12A |
| Motherboard: ASUS ProArt Z890-Creator WiFi BIOS version: 3002 |
| RAM: 2x Kingston FURY Renegade 24GB (48 GB total) Core Ultra: JEDEC 6400 “B” Spec Core Ultra Plus: JEDEC 7200 “B” Spec |
| GPUs: NVIDIA GeForce RTX™ 5080 Driver Version: 591.74 |
| PSU: EVGA SuperNOVA 1200W P2 |
| Storage: Samsung 980 Pro 2TB |
| OS: Windows 11 Pro 64-bit (26200) Power Profile: Balanced |
Benchmark Software
| Lightroom Classic 15.2 — Puget Bench for Lightroom Classic 1.0.0 |
| Photoshop 27.4 — Puget Bench for Photoshop 1.0.5 |
| Premiere 26.0.1 — PugetBench for Premiere Pro 2.0.1 |
| After Effects 26.0 — Puget Bench for After Effects 1.1.0 |
| DaVinci Resolve 20.3.2 — Puget Bench for DaVinci Resolve 2.0.0 |
| Unreal Engine 5.7 |
| Visual Studio 2022 |
| Cinebench 2026 |
| V-Ray 6.00.01 |
| Blender 5.0 |
| MLPerf Client v1.0 |
| Llama.cpp 5122 |
We followed our standard methodology for this review, with Intel and AMD-based platforms featuring ASUS ProArt motherboards and NVIDIA GeForce RTX™ 5080 GPUs. Windows, BIOSes, and drivers were all up to date as of the start of the testing. In line with our focus on professional workflows, we kept the processors running stock: overclocking features such as ASUS MCE and MLB were disabled, as was AMD’s PBO, and the Intel processors were run with the default “Performance” power plan. RAM was locked to the maximum CPU-supported frequency at JEDEC timings: 5600 for AMD and 6400 or 7200 for Intel, depending on the model. Additionally, we left Windows security settings like VBS in their default (enabled) state.
Intel APO was technically enabled, but we did not test any applications that should have performance improvements from it; iBOT was not.
To cover a wide range of possible workflows, we tested with nearly every content creation-focused benchmark we have access to. This includes most of the Puget Bench for Creators suite, three offline CPU-based renderers, our in-development Unreal Engine benchmarks (both in-engine and engine compilation), and a smattering of AI benchmarks.
Photography: Lightroom Classic
We have pulled out a variety of scores and calculated results from our benchmarks, which we will present one application at a time – starting with Lightroom Classic. To that end, we have computed geometric means for import and export times in addition to the camera-specific subtests. We won’t spend a lot of time analyzing the latter, but they are available in the charts for those interested.
Historically, Lightroom Classic has been a lighter application, which predominantly cared about single-threaded speed. Ongoing updates have shifted the importance of multi-core performance and GPU acceleration, and with our new 1.0 benchmark, we can better capture those requirements.


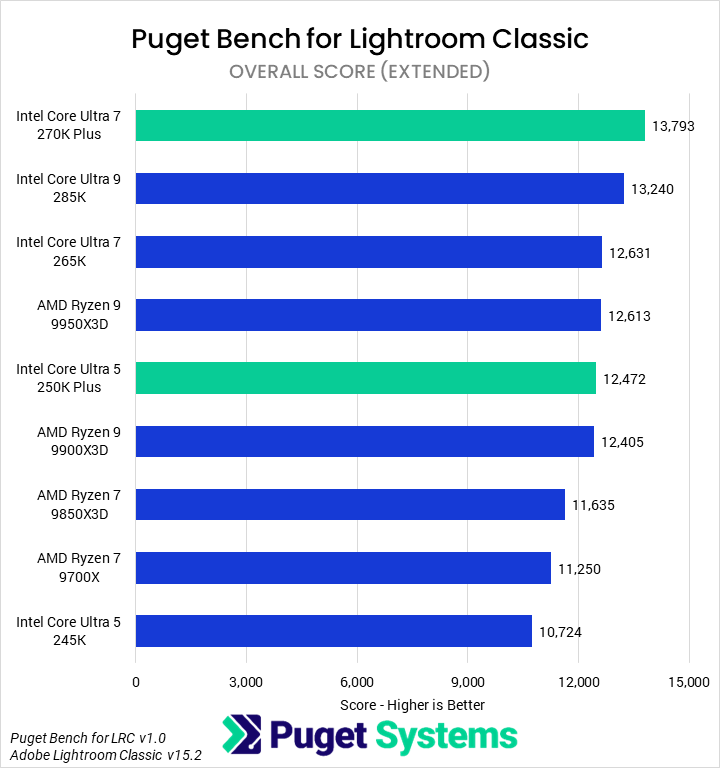
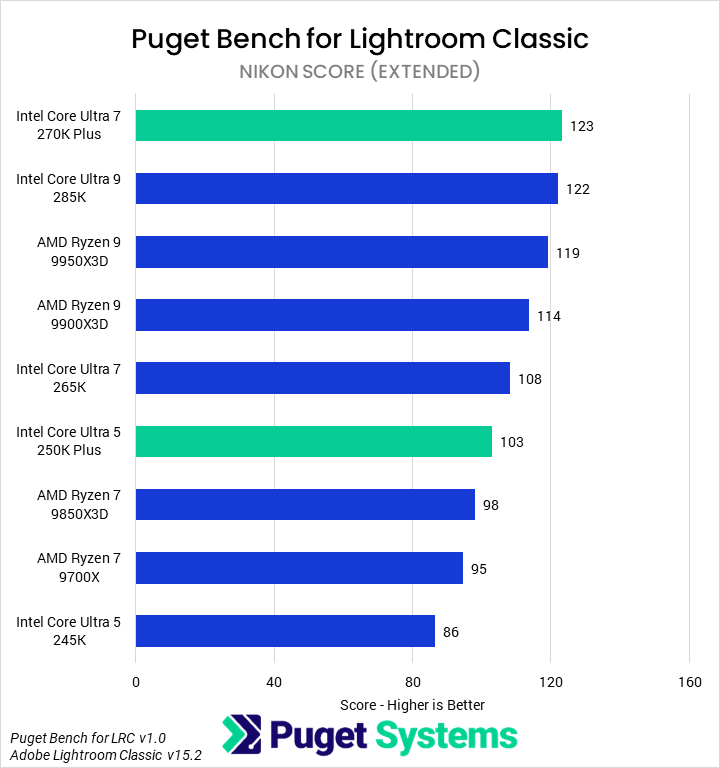
The Overall score (Chart #1) starts off strong for the new Core Ultra 200S Plus parts, with the 270K Plus leading the chart. It was 4% faster than the 285K, 9% faster than the 265K, and 23% faster than the similarly-priced 9700X. Given that the 265K and 9950X3D perform similarly, it also leads the 9950X3D by about 9%. The 250K Plus, though not a chart leader, is similarly impressive, matching the 9900X3D in performance due to a 16% uplift over the 245K.
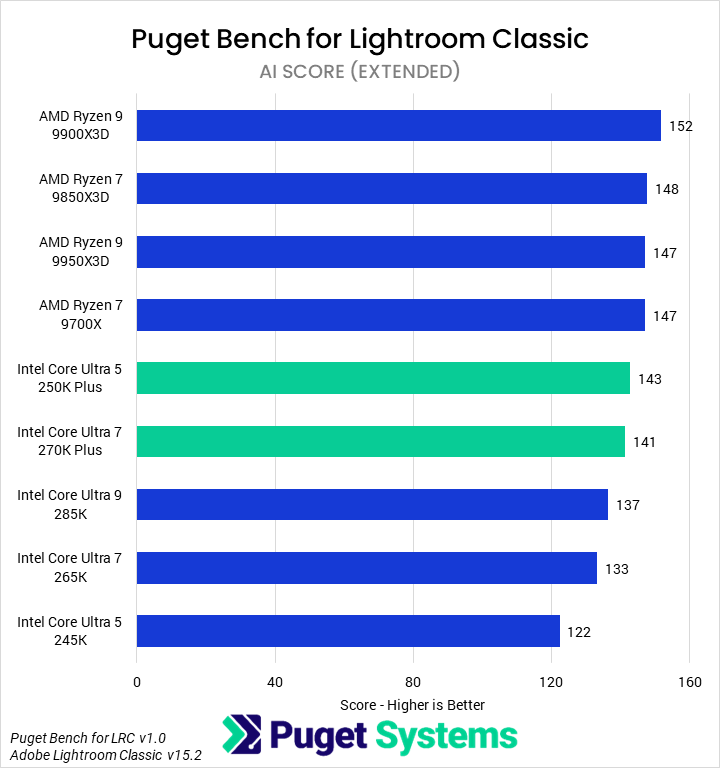
Interestingly, AMD’s Zen 5 architecture seems to allow for better AI performance (Chart #2) in Lightroom Classic than Intel’s current-gen architecture, as all of the Ryzen 9000 parts outperformed all of the Intel parts. Both the 250K Plus and 270K Plus managed to close the gap somewhat, likely indicating that Lightroom Classic AI performance is closely tied (on the CPU side) to memory latency. The 270K Plus was 4% slower than the 9700X but 4% faster than the 285K and 8% faster than the 265K. The 250K saw an even more impressive 17% improvement over the 245K.
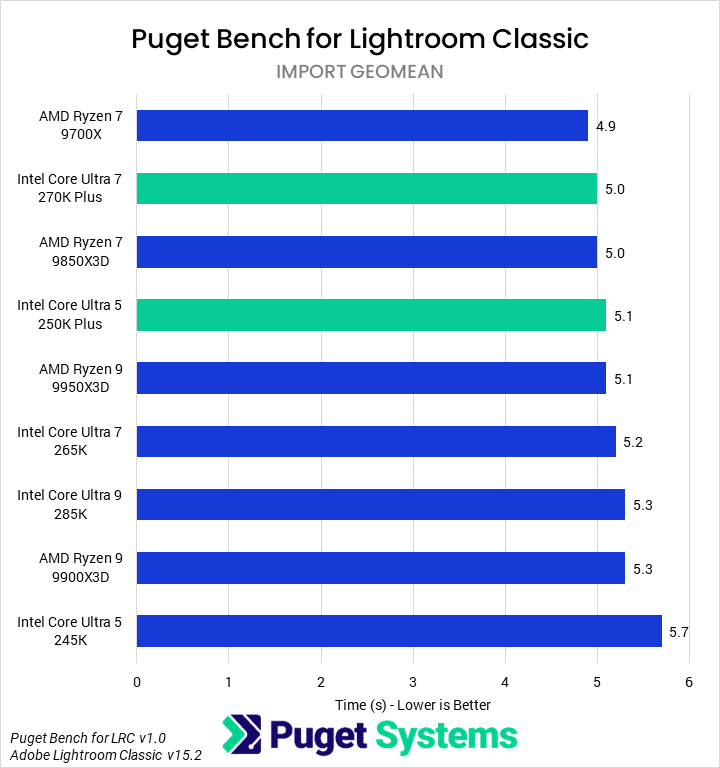
In import tasks (Chart #3), we found the 9700X to be the fastest, on average. The 250K Plus and 270K Plus did lead the Intel CPUs, representing small improvements over their 245K and 265K counterparts. However, these differences are very small, across the board, in absolute terms. The 9700X finished this task less than a second more quickly than the 245K, and less than half a second faster than any other CPU.
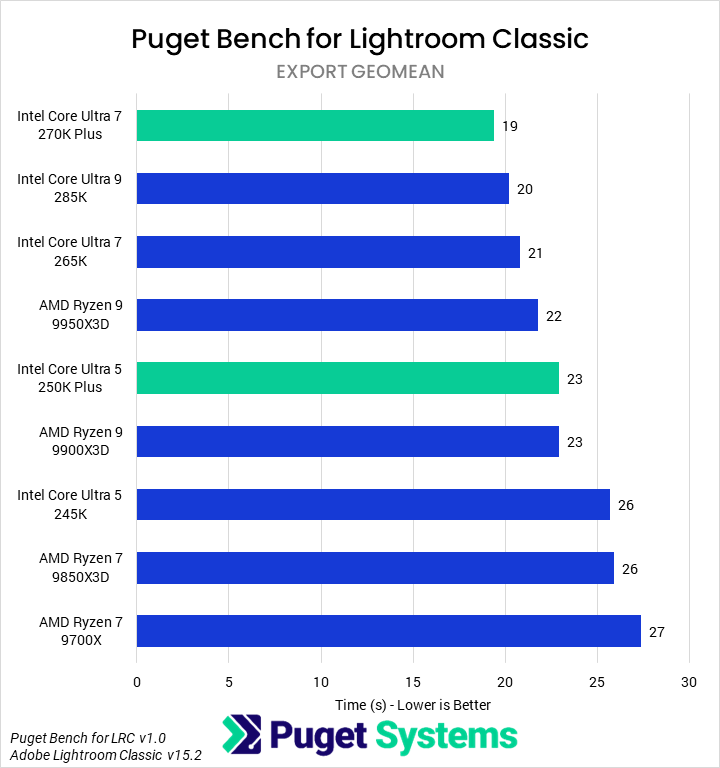
We saw more differentiation in the Export tasks (Chart #4), which appear to scale with multi-core performance within CPU families. The 270K Plus was the fastest, with a one-second (5%) lead over the 285K, 9% lead over the 265K, and 30% lead over the 9700X. The 250K Plus performed well too: 12% faster than the 245K, managing to match the 9900X3D.
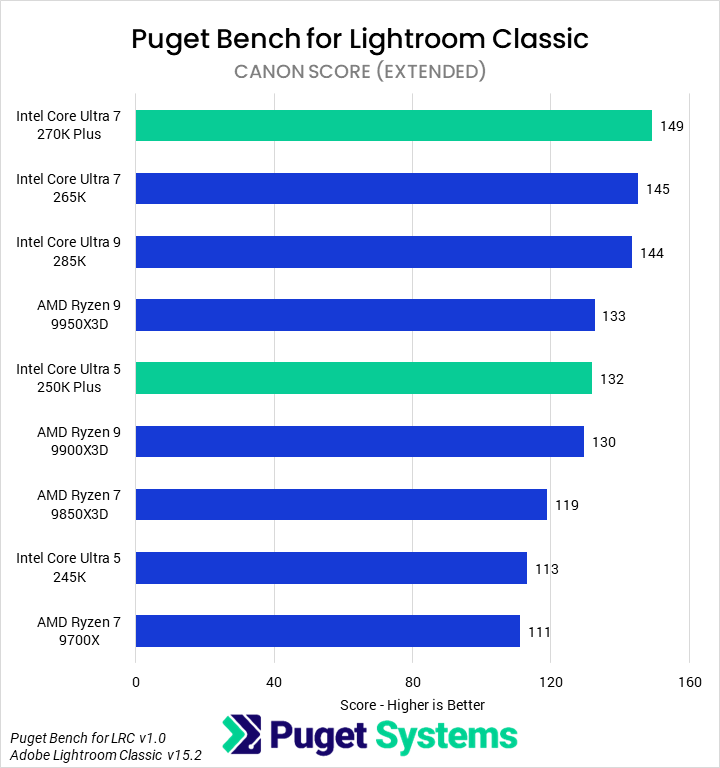
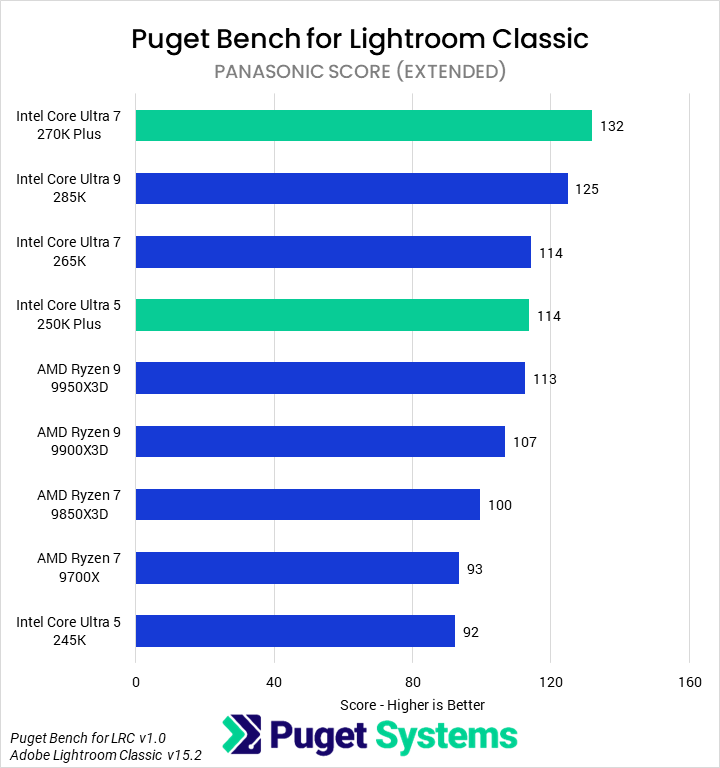
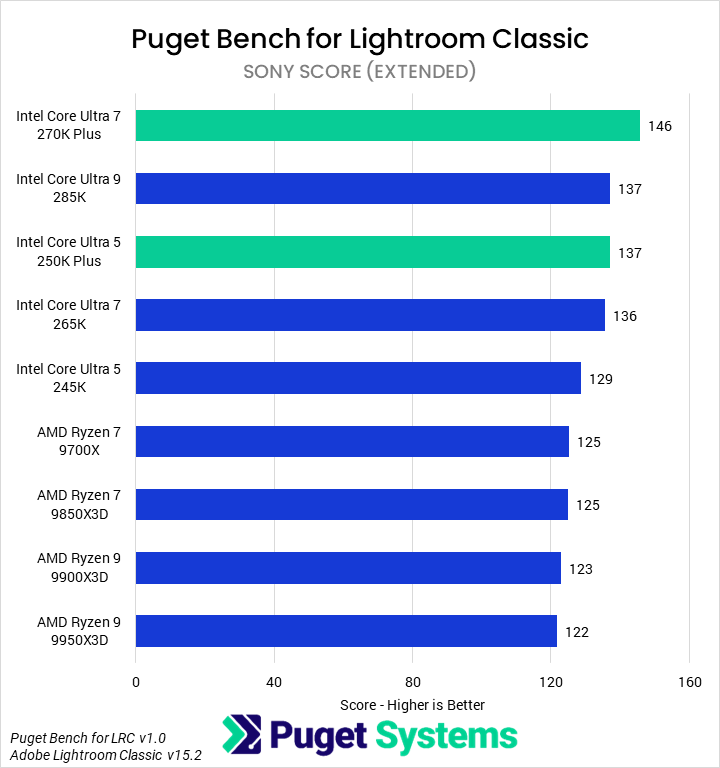
Across all of the camera-specific scores, the 270K Plus was the fastest CPU tested. The 250K Plus was much more inconsistent in its placing, but – except for the Canon tests – was nearly always at parity with the 265K and substantially faster than the 245K.
Previously we have recommended the 265K as the best all-around Lightroom Classic CPU. Based on this testing, the Intel Core Ultra 7 270K Plus replaces that, offering both the best performance and one of the best price-to-performance ratios of modern CPUs. The 250K Plus is also a great value for a lower-end workstation. However, photographers may want to balance this guidance against the performance we will examine in the next section: Adobe Photoshop.
Graphic Design: Adobe Photoshop
Photoshop is a primarily CPU-bound application that favors per-core performance and low latency in CPU design. Since the release of AMD’s Ryzen 9000 Series, it has tended to favor those processors – and especially the X3D variants. We are interested in seeing whether the additional cores and improved memory subsystem in the new Core Ultra 200S Plus models meaningfully improve the performance of Intel’s chips, and especially if they can offset the 270K Plus’ lower maximum single-core boost as compared to the 285K.


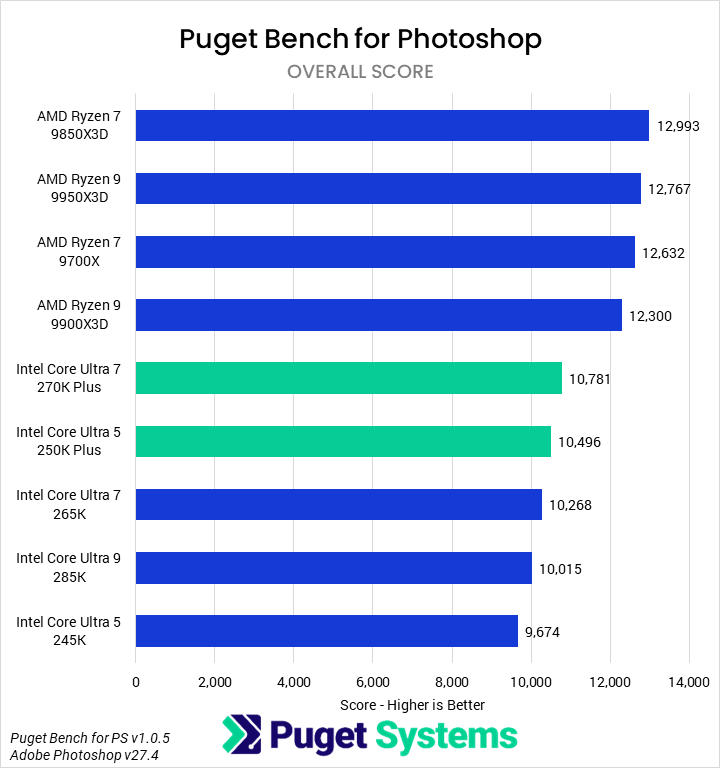
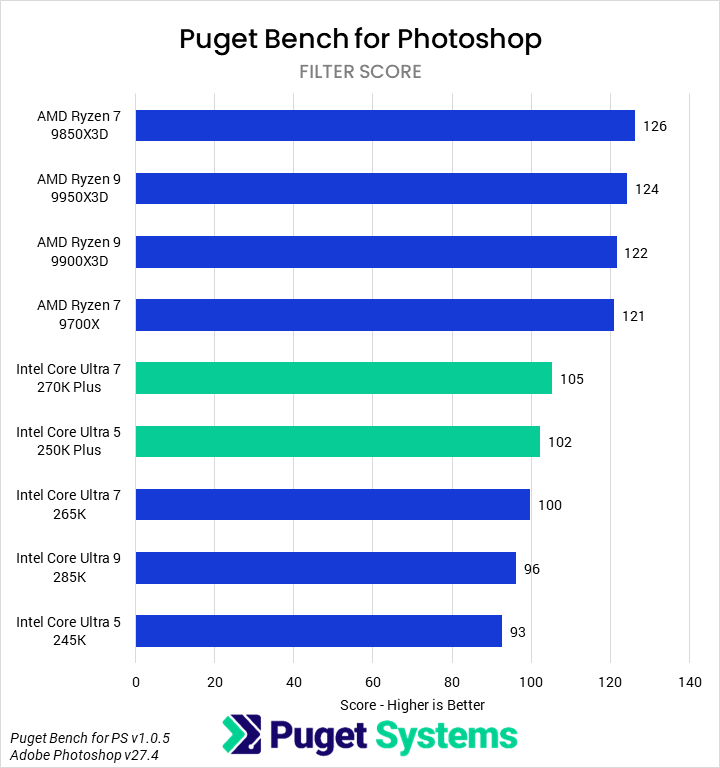
In the overall score (Chart #1), we found that the 270K Plus and 250K Plus did see modest performance gains over their 265K and 245K counterparts, allowing both to outperform all of the non-Plus Intel processors. In particular, the 270K Plus was 5% faster than the 265K, and the 250K Plus was 8% faster than the 245K. However, both still fell well short of AMD’s offerings, with the 270K Plus coming in 15% slower than the 9700X. The 9850X3D remains the fastest Photoshop chip, 21% faster than the 270K Plus.
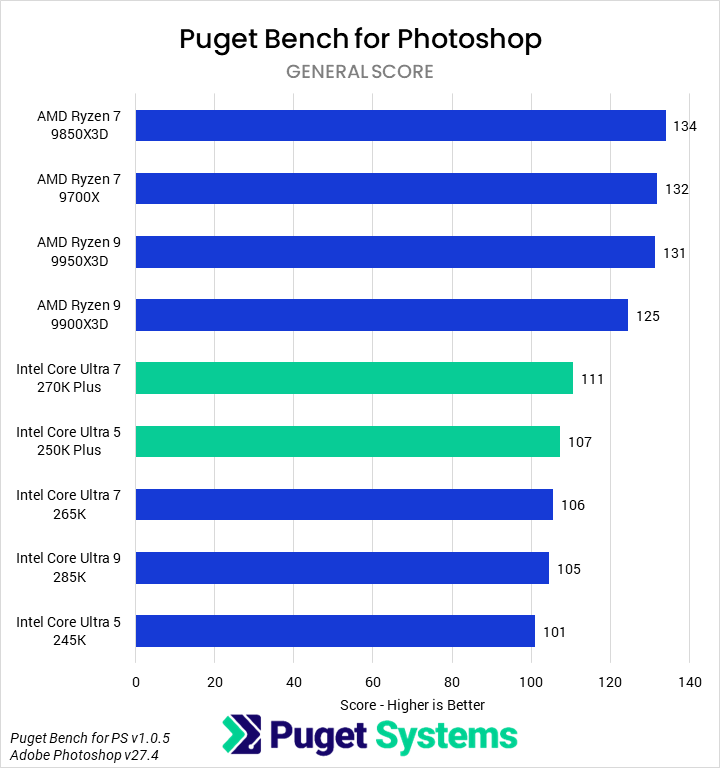
Both the general score (Chart #2) – which captures file loading and saving, subject selection and masking, and some tools, among other things – and the filter score (Chart #3) showed basically identical scaling. That means the relative percentages between each model are the same as we saw for the overall score, indicating that CPU performance is very consistent across the various types of workloads our benchmark tests.
We would recommend AMD Ryzen processors for Photoshop users, with the 9850X3D being particularly performant while the 9700X offers a great price-to-performance ratio. Although the 270K Plus and 250K Plus both offer better value than the non-Plus Intel CPUs, they are a second-class option compared to AMD in this situation.
Video Editing: Adobe Premiere
The next application we tested was Premiere, once again using our Puget Bench suite. We recently looked at the 2.0 version of this benchmark and found some interesting changes in hardware utilization based on the new, modern effects and improved capabilities of Premiere version 26.0.


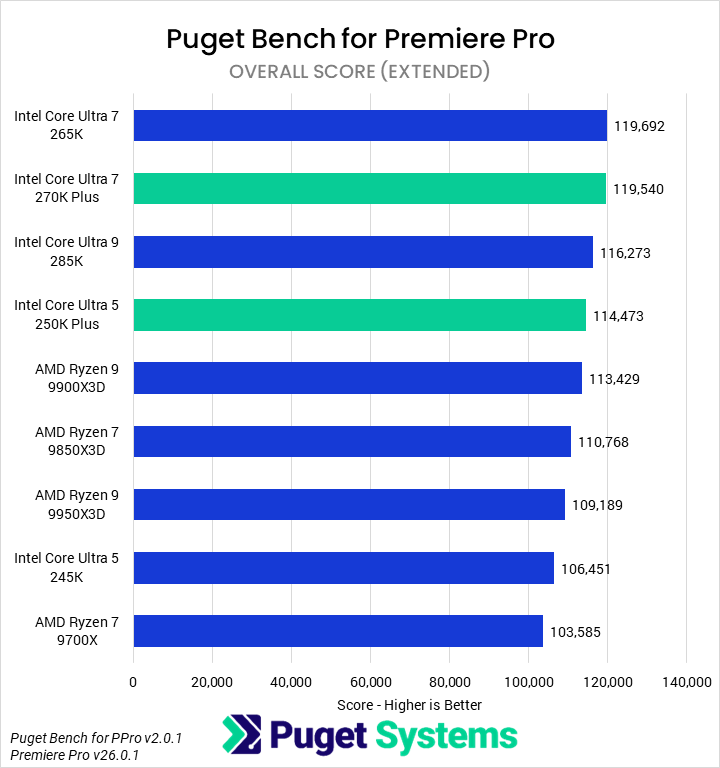
Starting with the Overall score (Chart #1), we found that Intel’s Core Ultra 7 270K Plus performed identically to the 265K and was 3% faster than the 285K. All three of these results are within the margin of error of this test. Compared to its nearest price competitor, the 9700X, the 270K Plus was 15% faster. The 250K Plus saw solid gains over the 245K, with 7% higher performance, and also outperformed every Ryzen CPU tested. When using a 50 Series GPU like the GeForce RTX 5080, the overall difference in performance between modern processors is relatively small – we measured just a 16% difference from the fastest to slowest processor – but the new Core Ultra 200S Plus CPUs nevertheless offer top-tier performance for their price.
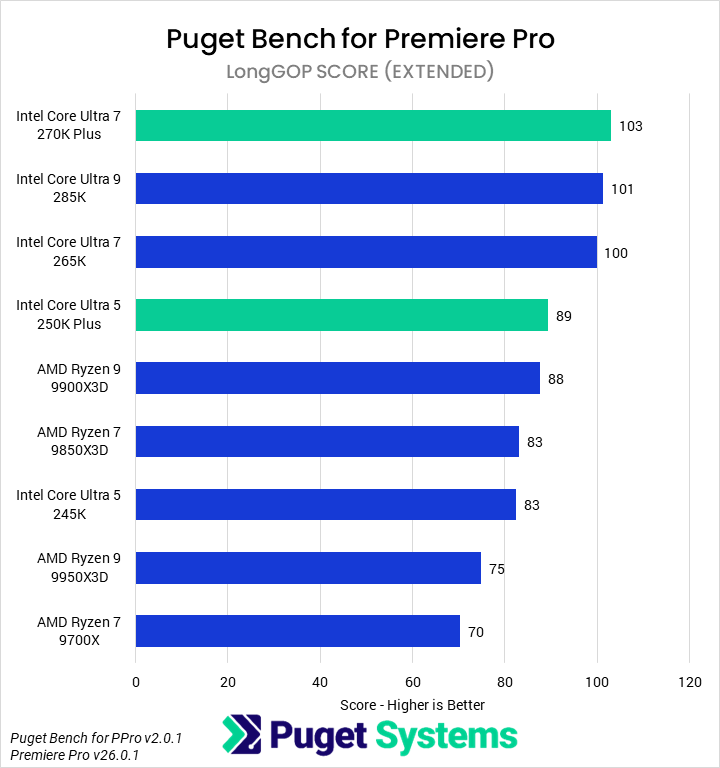
Moving on to the LongGOP tests (Chart #2), we see a clear differentiation between Intel and AMD processors, with all of the former outperforming all of the latter. This is due to Intel’s iGPU offering superior performance in certain LongGOP codecs when using QuickSync, compared to the media engines in NVIDIA GPUs. That isn’t the case for every “flavor” of LongGOP – H.264 4:2:0 8-bit is an exception, for example – but generally speaking, Intel processors still offer superior media acceleration in Premiere. Systems configured with GPUs other than 50 Series would see an even larger difference between Intel and AMD processors in these tests. As far as actual performance differences go, the 270K Plus, 285K, and 265K were once again at parity, with the 270K Plus outperforming the fastest AMD CPU (the 9900X3D) by 17% and the 9700X by 47%. The 250K Plus was 7% faster than the 245K.
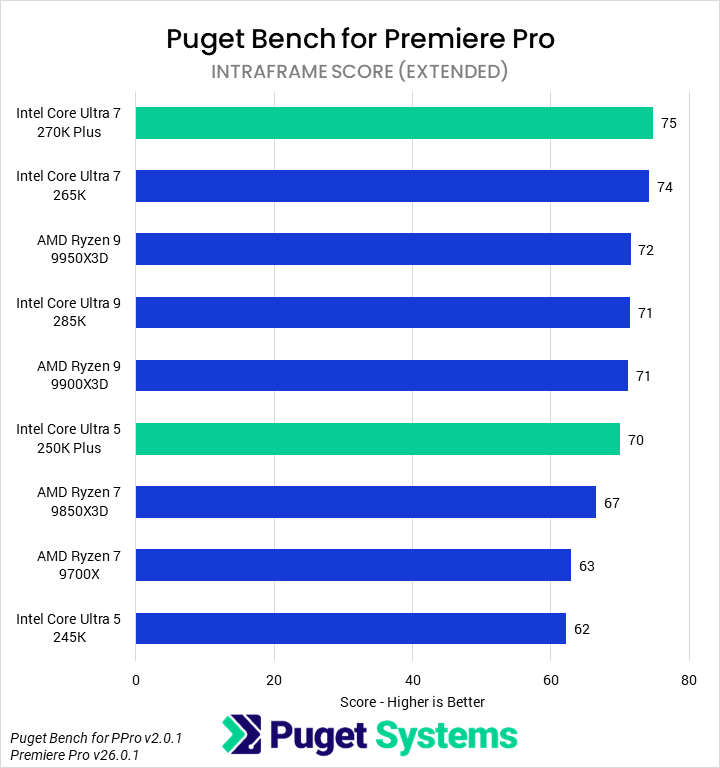
Intraframe codecs (Chart #3), though relatively light, are wholly CPU-bound. We found that the fastest CPUs were the 270K Plus and 265K, followed by the 9950X3D, 285K, and 9900X3D – all less than 5% behind. The 250K Plus saw 13% performance improvements over the 245K.
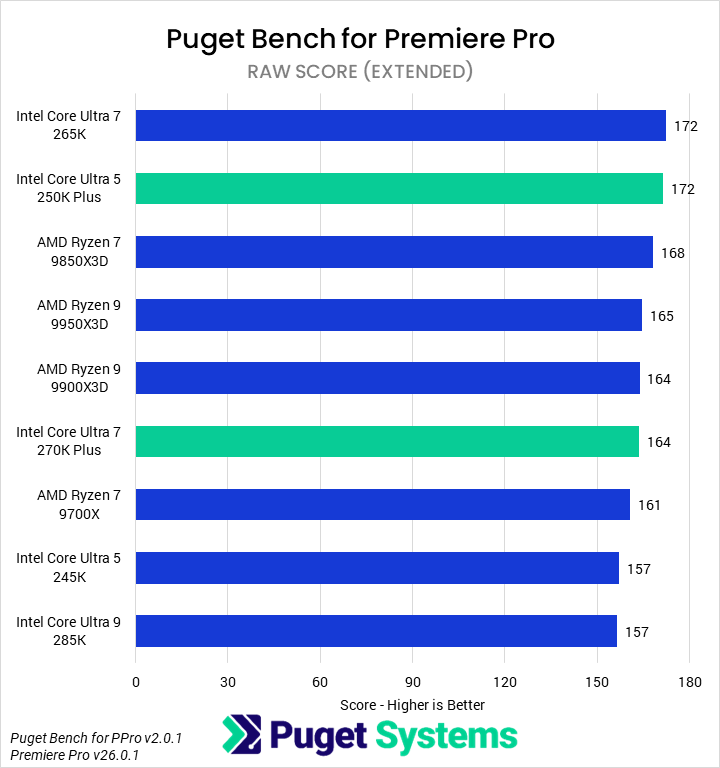
In contrast to Intraframe codecs, RAW codecs (Chart #4) are both heavy and at least partially GPU-accelerated. Intel’s 250K Plus led the chart alongside the 265K, slightly ahead of the 9850X3D. The RAW score results are fairly noisy, given the low spread (only 10%) from top to bottom. Many results are within the margin of error of other results, likely due to the increasing GPU dependence of these formats.
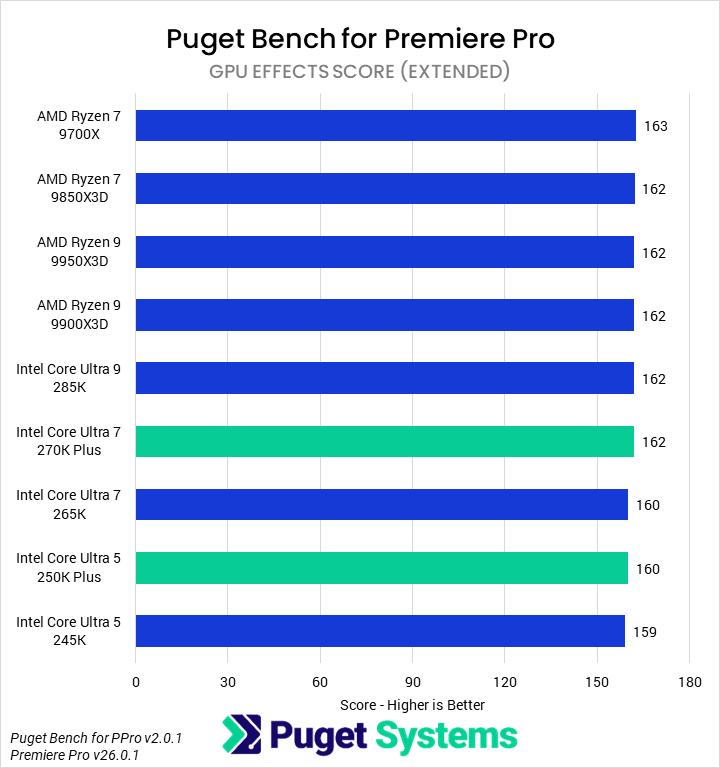
The final category of tests we looked at was GPU Effects (Chart #5), which are wholly GPU-bound for any modern high-end processor. All of the tested CPUs performed identically here.
Heavy Premiere users will want to invest in an Intel Core Ultra processor (provided it is not an “F” spec, lacking an iGPU) to take advantage of the incredibly performant QuickSync media acceleration. Which CPU within that family is best may depend on budget, as we found that the 265K and 270K Plus performed nearly identically, and only somewhat faster than the 250K Plus. Intel processors are especially beneficial for users without access to a GeForce RTX 50 Series GPU.
Motion Graphics: Adobe After Effects
Moving on to Adobe After Effects, we found a slight performance regression between version 25.6 – the most recent we had tested with prior to this article – and version 26.0, which we used here. We are looking into what happened, but for now, results may be a bit lower than in previous articles. Nonetheless, the relative performance of the CPUs seems to be correct.
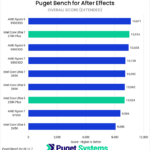


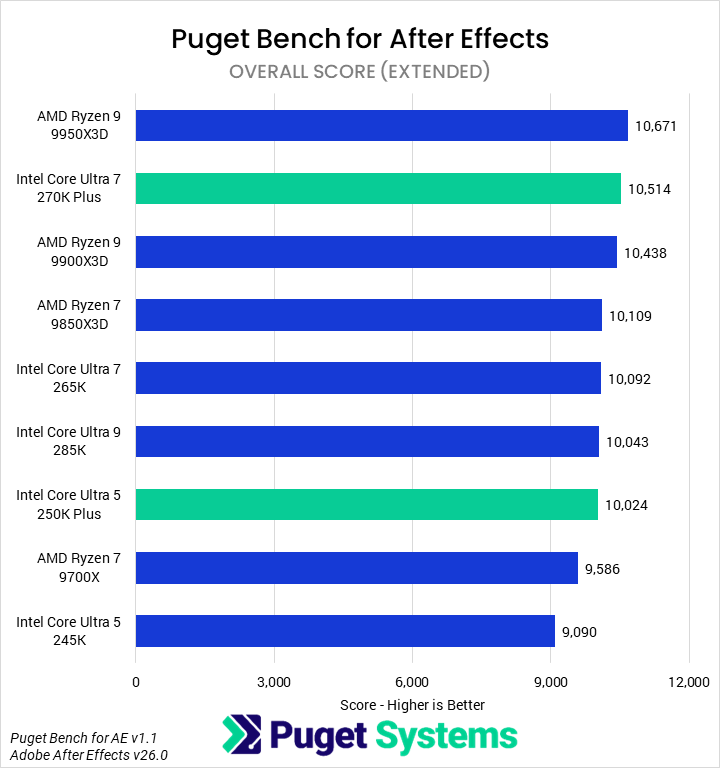
In the Overall score (Chart #1), we found that the 9950X3D was the fastest CPU for After Effects – just 1% ahead of the 270K Plus. The 270K Plus, in turn, led the 265K and 285K by 4%, and the 9700X by 10%. The 250K Plus saw a 10% uplift over the 245K, though it was still toward the bottom of the chart.
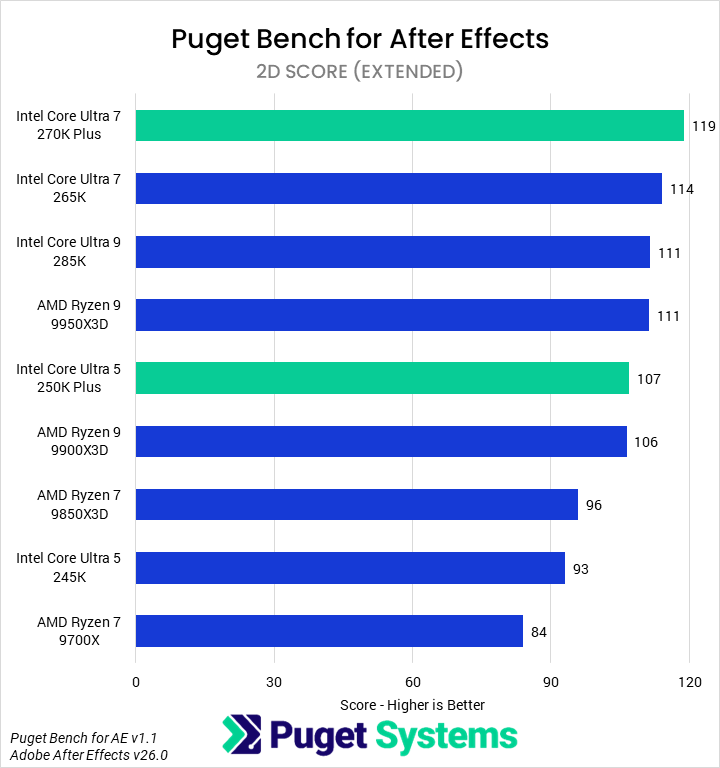
However, performance in After Effects depends a lot on the specific workflow. For our purposes, we can largely split the subscores into two categories: 2D work on one hand, and 3D and Tracking on the other. In 2D workflows (Chart #2), the 270K Plus was the fastest CPU we tested, leading the 265K by 4% and the 285K and 9950X3D by 7%. It was also 42% faster than the 9700X. The 250K Plus showed a 15% performance improvement over the 245K, putting it just behind the 9950X3D. For 2D work, the new Core Ultra 200S Plus processors offer fantastic performance and value!
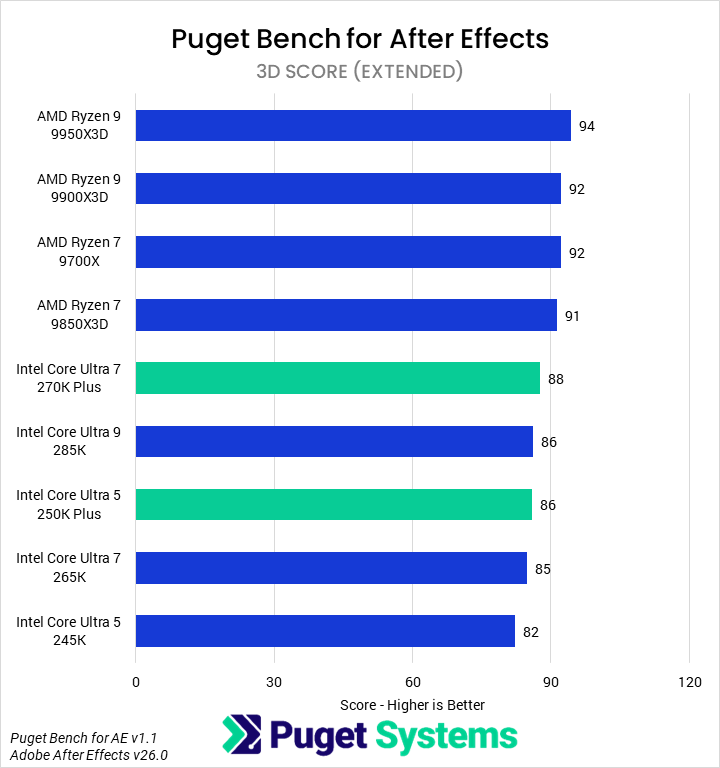
That is not the case in 3D (Chart #3) and Tracking (Chart #4) workloads, though. AMD’s Ryzen processors lead both of those categories, with the fastest Intel models coming in behind the slowest AMD ones. 3D tests, which are largely GPU accelerated, show relatively small performance deltas – but the 9700X, for instance, is still 5% faster than the 270K Plus. We do see improvements here for Intel, with the Plus processors improving on their counterparts by about 4%. Margins in the Tracking tests were similar, although the 250K Plus created an even larger gap between it and the 245K.
Whether the new Intel Core Ultra 200S Plus processors are worth it for After Effects will depend a lot on the specific workflows being used. They are fantastic for 2D work, but offer a less compelling value in 3D workflows and heavy motion tracking. On balance, we think this means 2D animators and motion designers will often want to go with a 270K Plus; however, dual-users of After Effects and Photoshop will likely prefer an AMD CPU.
Video Editing/Motion Graphics: DaVinci Resolve Studio
Moving on from Premiere and After Effects, we have DaVinci Resolve – which offers the capabilities of both in one application, thanks to the inclusion of Fusion. Compared to Premiere, DaVinci Resolve has traditionally made better use of hardware, particularly the GPU. As with Premiere, we recently updated to Puget Bench 2.0 and published an article examining the performance differences we saw with the revamped tests.
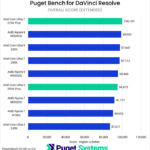

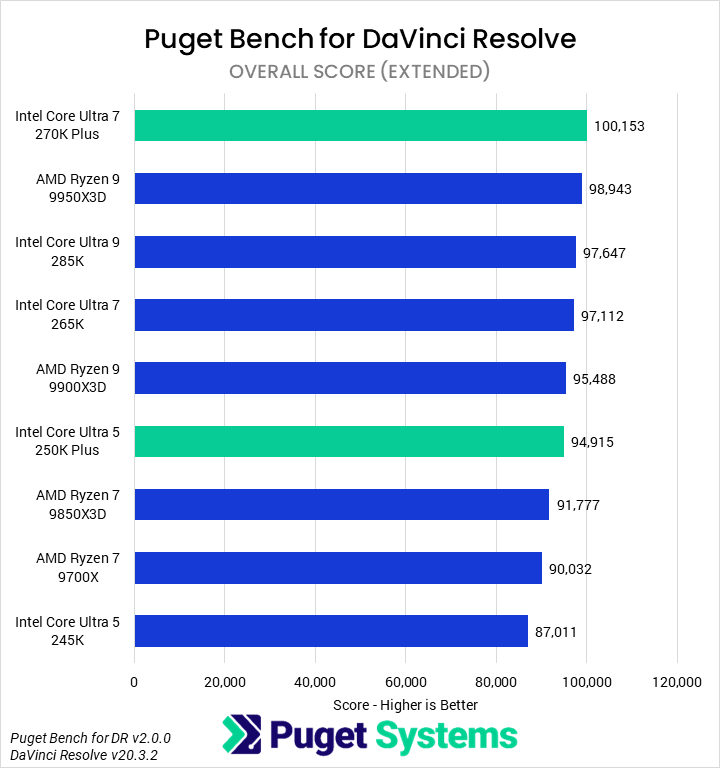
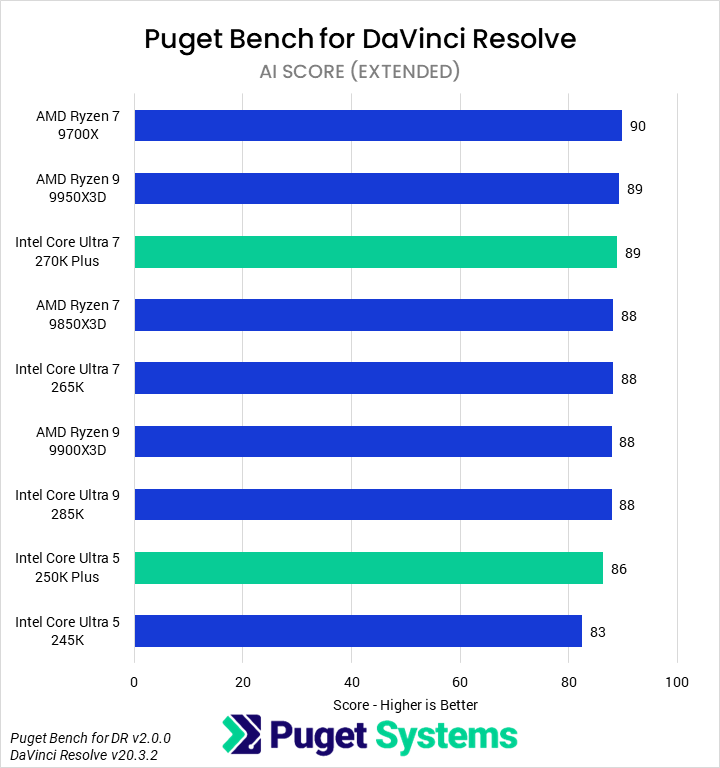
In terms of overall performance (Chart #1), the new Core Ultra 7 270K Plus was the fastest CPU we tested, beating the 9950X3D by a marginal 1%, the 285K and 265K by 3%, and the 9700X by 11%. The 250K Plus saw a 9% performance improvement over the 245K, nearly matching the 9900X3D.
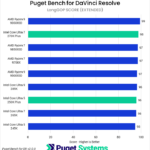
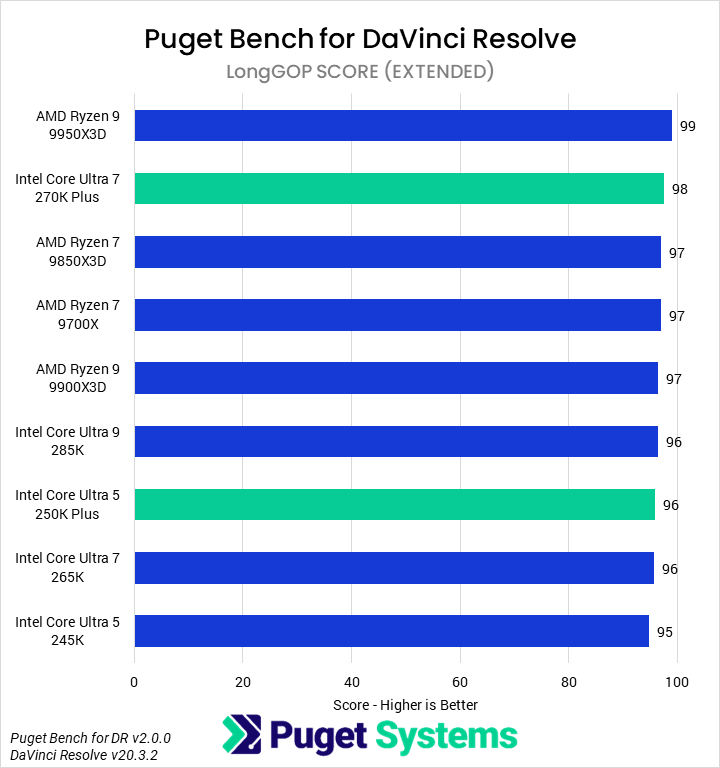
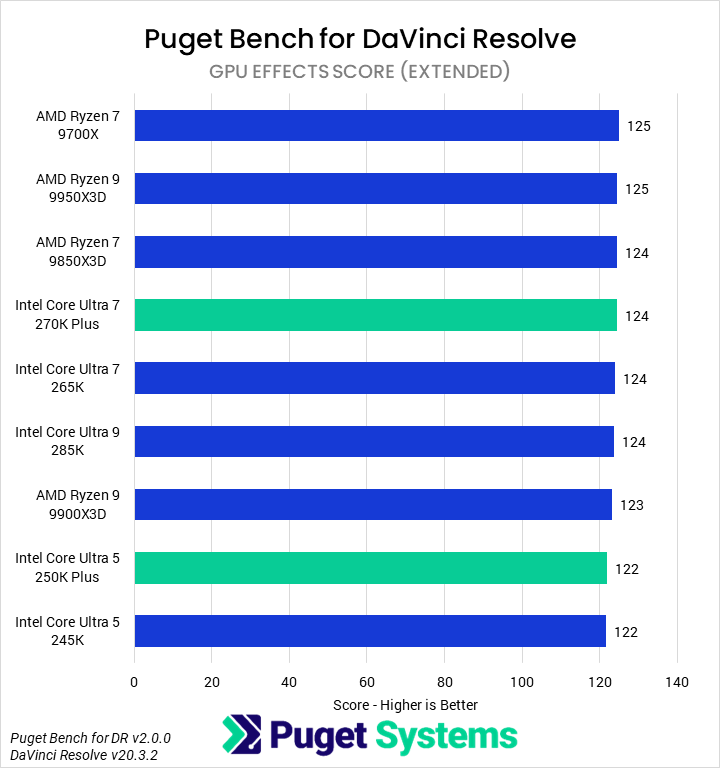
In LongGOP media (Chart #2), all of the tests are accelerated by the discrete GPU, so performance is identical across CPUs. Similarly, GPU Effects (Chart #5) shows no distinction between CPUs, and AI Effects (Chart #7) shows very little.
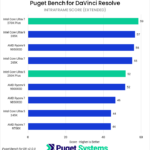
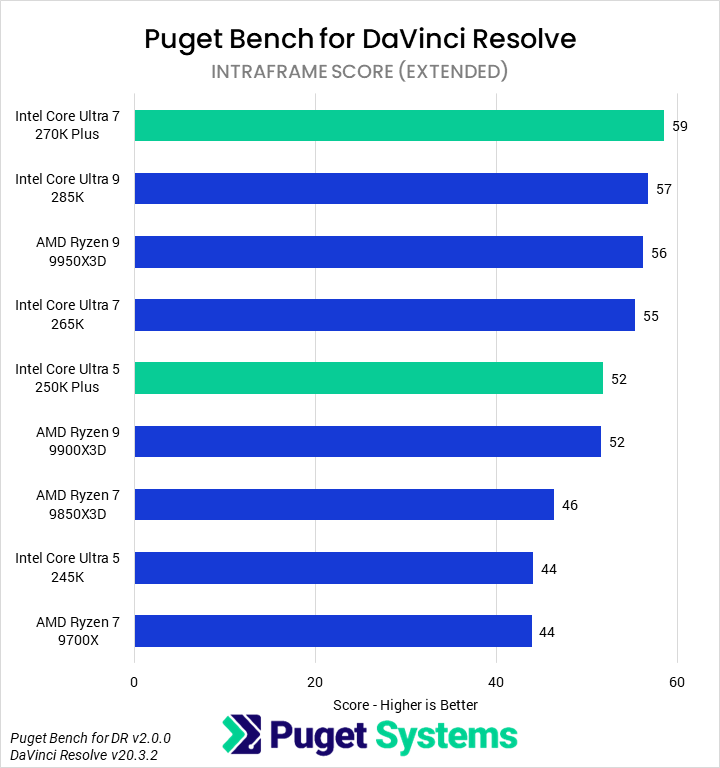
Intraframe codecs (Chart #3) do show differentiation, though. We found the 270K Plus to be the fastest CPU, with roughly a 5% advantage over the 285K, 9950X3D, and 265K. It was 34% faster than the 9700X. On the lower end, the 250K Plus was 18% faster than the 245K.
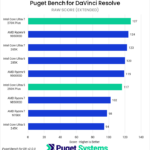
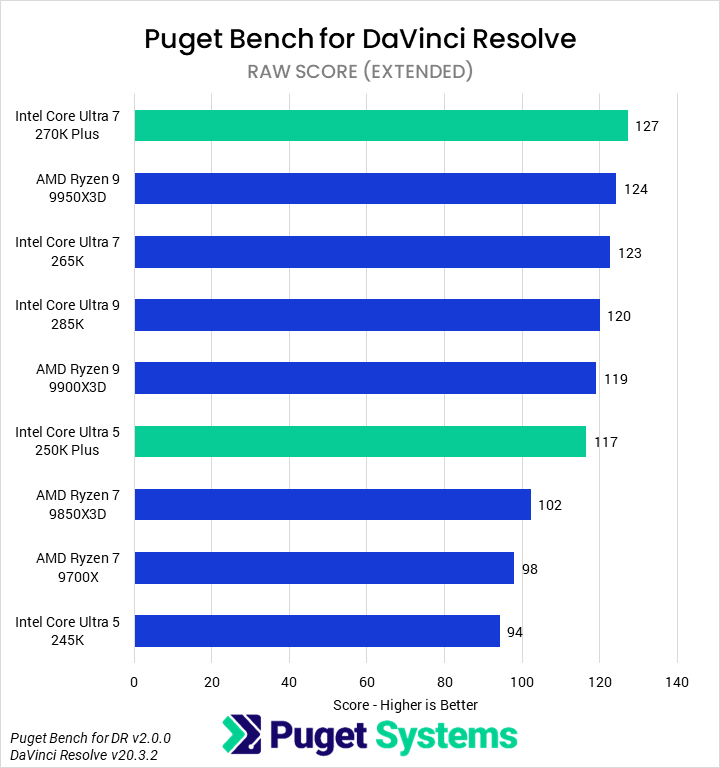
Working with RAW codecs (Chart #4), we saw a similar trend, where the 270K Plus was nominally the fastest due to a small lead over the 9950X3D, 265K, and 285K, and had a 30% performance advantage over the 9700X. The 250K Plus almost matched the 9900X3D again, with a 24% uplift over the 245K.
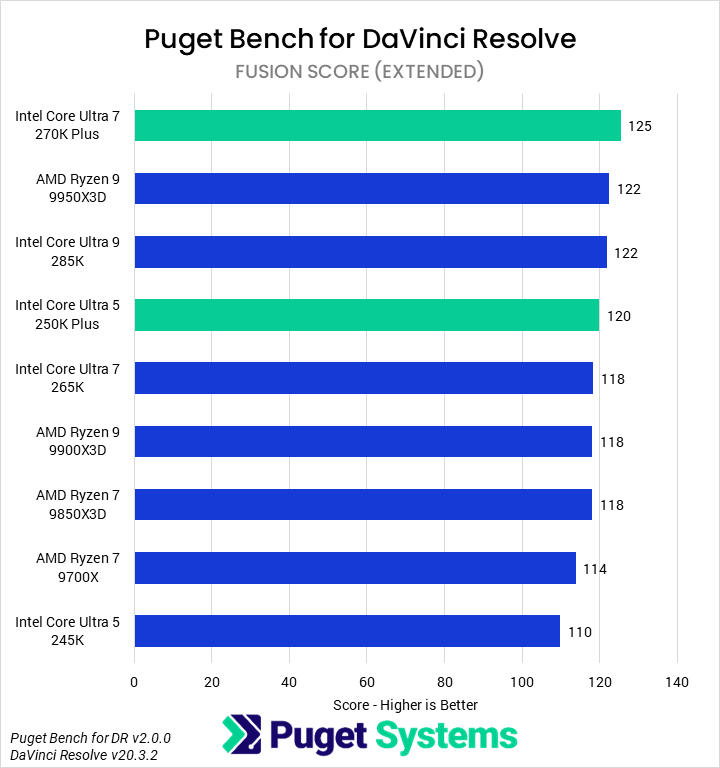
Finally, in Fusion workloads (Chart #6), we saw very little differentiation between the processors – though in this case, it is primarily based on single-core performance rather than other hardware in the system. The 270K Plus was technically the fastest, beating the 9950X3D and 285K by 2%. It was also 6% faster than the 265K and 10% faster than the 9700X. Impressively, the 250K Plus managed to outperform the 265K as well, thanks to a 9% improvement from the 245K.
We would recommend that users looking for a DaVinci Resolve workstation go with the 270K Plus. It offers the best performance nearly across the board at a great price. The 250K Plus would make for a great budget option as well. Like Premiere, this is especially the case if the machine will not have a 50 Series NVIDIA GPU, as that will mean a lack of hardware acceleration for many LongGOP variants.
Game Dev/Coding: Unreal Engine & Visual Studio
One area where AMD has been increasing pressure on Intel is the game development space. Our in-house Unreal Engine game-dev benchmarks examine compiling shaders and building lighting in-engine, as well as the engine compile time in Visual Studio. Although many studios will want dedicated servers for these tasks, independent developers often have to multi-purpose one machine. The latter task is also an indication of broader code compilation performance. However, one area we will not be examining is in-engine FPS/performance.
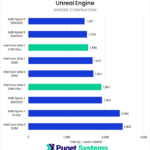
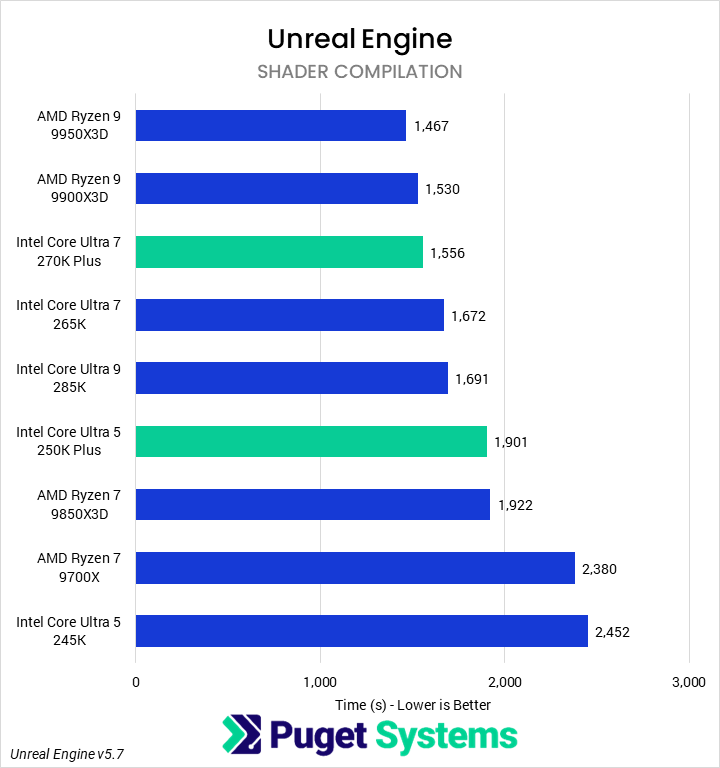
In Unreal Engine shader compilation (Chart #1), AMD’s Ryzen 9 X3D processors continued to offer superior performance. The 270K Plus was 6% slower than the 9950X3D, though it did manage to outperform both the 285K and 265K by about 7% and was 35% faster than the 9700X. The 250K Plus saw even larger gains, improving on the 245K by 23% and managing to match the 9850X3D.
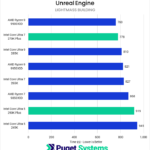
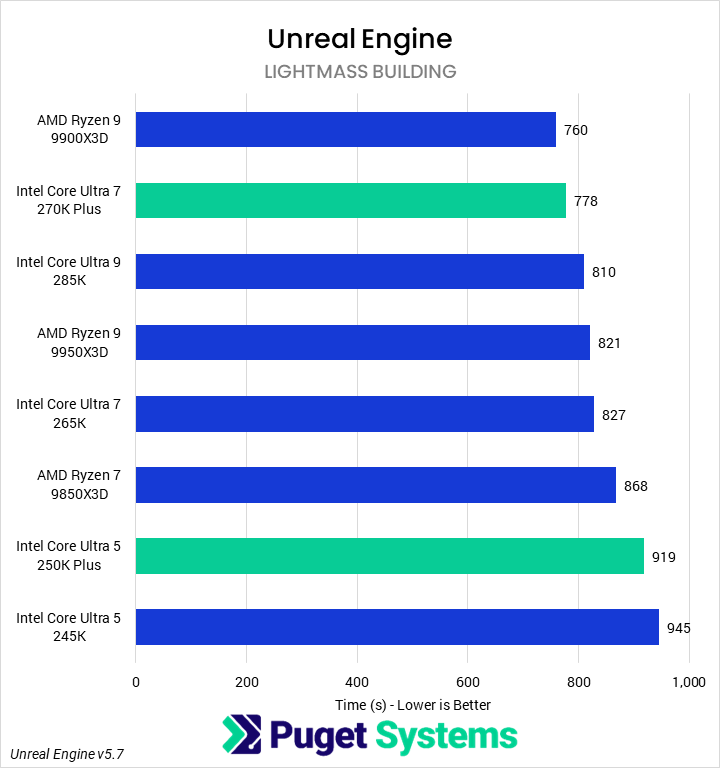
Lightmass building (Chart #2) tends to scale similarly to shader compilation, but historically we have found that the results can be somewhat inconsistent. In this set of testing, the 9900X3D was the fastest processor, just ahead of the 270K Plus; that CPU, in turn, was 4% faster than the 285K and 5% faster than the 265K. We don’t have a comparison to the 9700X as it failed to run properly. The 250K Plus saw marginal gains of 3% over the 245K.
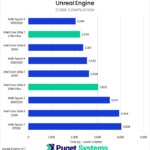
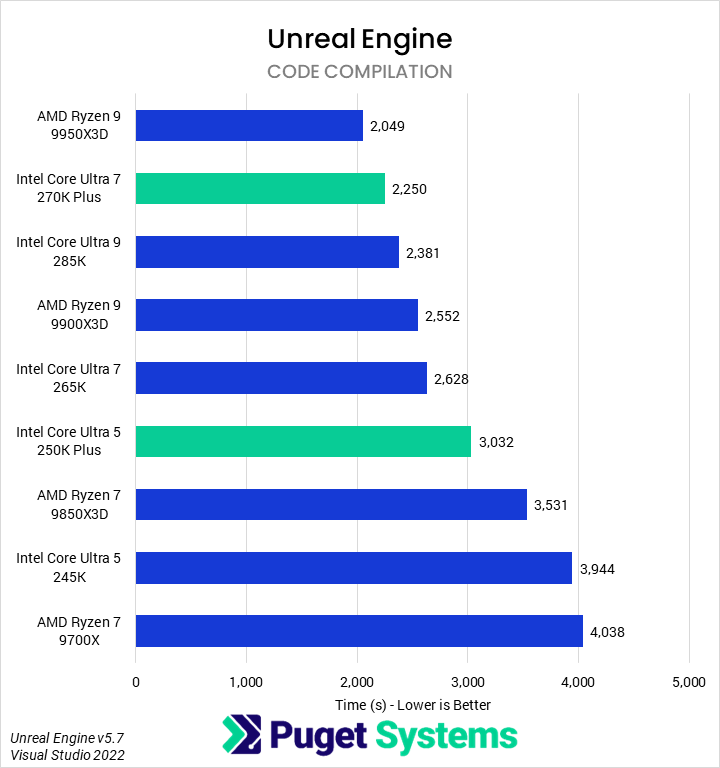
As stated earlier, the final area we test for game dev is compiling the Unreal Engine in Visual Studio (Chart #3). Here we found that the 9950X3D continues to be the fastest consumer CPU, finishing this task 9% faster than the 270K Plus. Historically, we have found this task to be very dependent on memory latency and bandwidth, benefiting AMD processors and especially the 3D V-Cache. Intel’s improvements to the memory subsystem, then, allow the 270K Plus to leap ahead of the older Core Ultra models. It finished the compilation 6% faster than the 285K and 15% faster than the 265K. Impressively, it takes only about half the time as the similarly-priced 9700X! The 250K Plus also performs admirably, with a 23% performance improvement over the 245K.
For the best performance in coding and game dev tasks, we would tend to recommend against the Core Ultra 200S Plus processors. Options from AMD, whether Ryzen desktop or Threadripper, will often give better performance. However, the 270K Plus does offer compelling performance for users on a budget.
CPU Rendering: Cinebench, V-Ray, and Blender
For our offline, CPU-based renderers, we tested with Cinebench, V-Ray, and Blender. We would tend to encourage users at this tier of performance to use GPU rendering instead, but that’s not always possible. We have included a few more results than is typical in our CPU reviews, but the primary scores of note are the Cinebench N-core, V-Ray CPU Mode, and Blender CPU score.

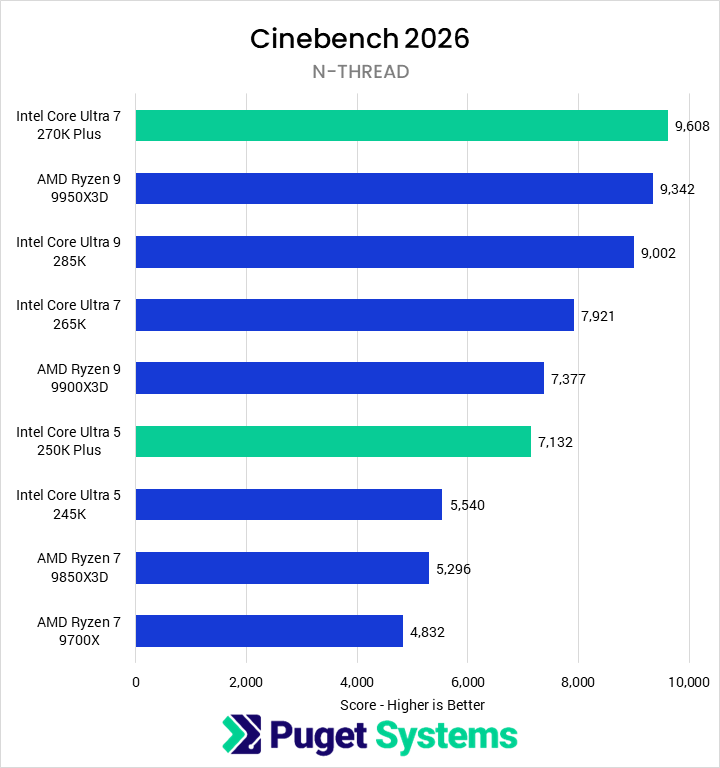
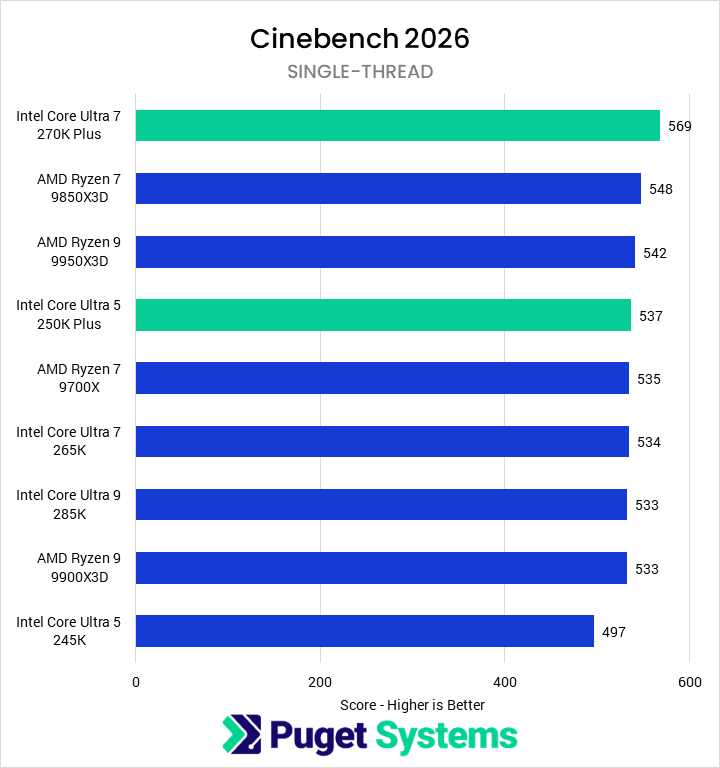
Starting with Cinebench N-thread (Chart #1), the 270K Plus was the fastest CPU we tested – inching just 3% ahead of the 9950X3D with a 21% performance improvement over the 265K. This meant it was also 7% faster than the 285K, likely due to a combination of faster E-cores and better memory latency and bandwidth; we expect that the chart would look somewhat different for those using overclocked processors or memory. Compared to the 9700X, the 270K Plus was 99% faster. The new 250K Plus nearly tied the 9900X3D and was 29% faster than the 245K. Single-threaded performance in Cinebench (Chart #2) is fairly meaningless in most cases, but the 270K Plus did put the improved memory to use, leading all the other CPUs by at least 4%. The generational improvement for the 250K Plus was even better, at 8% over the 245K.
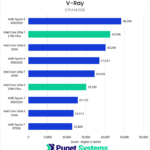
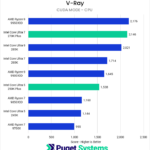
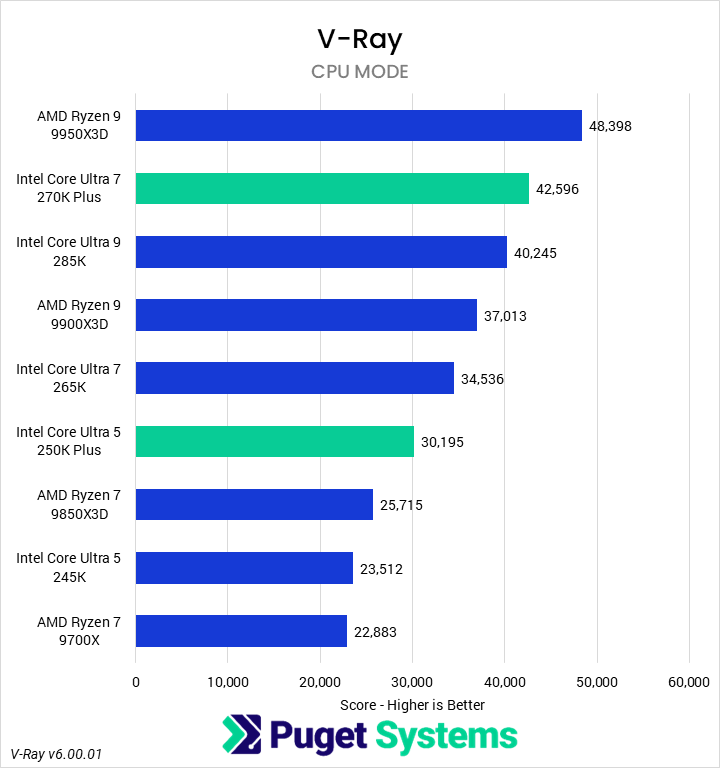
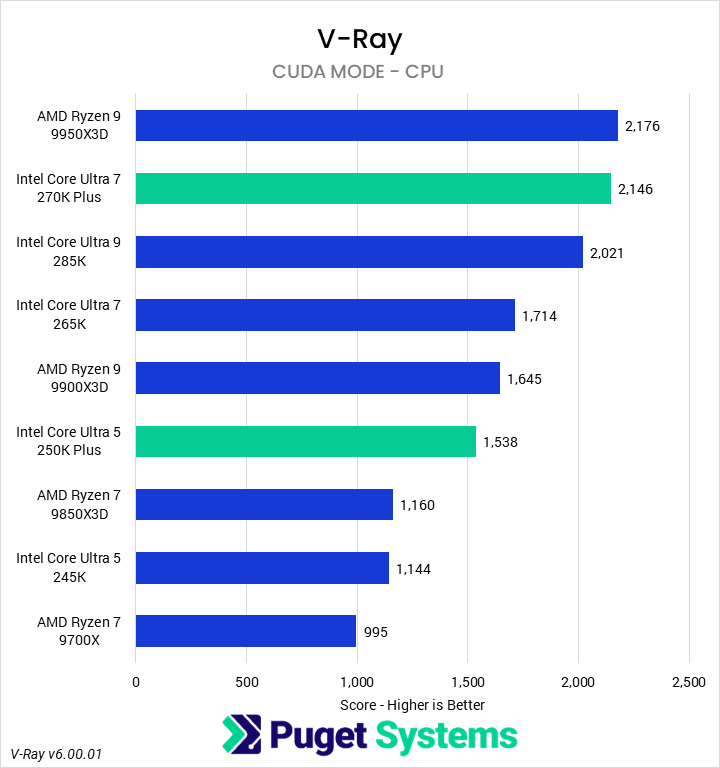
In V-Ray’s CPU Mode (Chart #3), AMD’s Ryzen 9 9950X3D was the fastest CPU we tested, outperforming the 270K Plus by 14% – a substantial amount, but far less than the price difference. Intel’s 270K Plus beat every other CPU, including the 285K (by 6%), 265K (23%), and 9700X (86%). Likewise, the 250K Plus was 28% faster than the 245K, positioning it 17% ahead of the 9850X3D. Running the CUDA engine on the CPU (Chart #4, representative of the additional performance potential when using hybrid rendering), we found that the 9950X3D and 270K Plus were equally performant. The 270K Plus was 6% and 25% faster than the 285K and 265K, respectively, and more than doubled 9700X. On the lower end, the 250K Plus was 34% faster than the 245K.
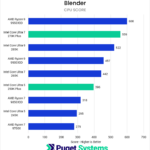
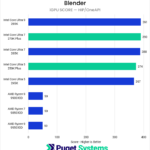
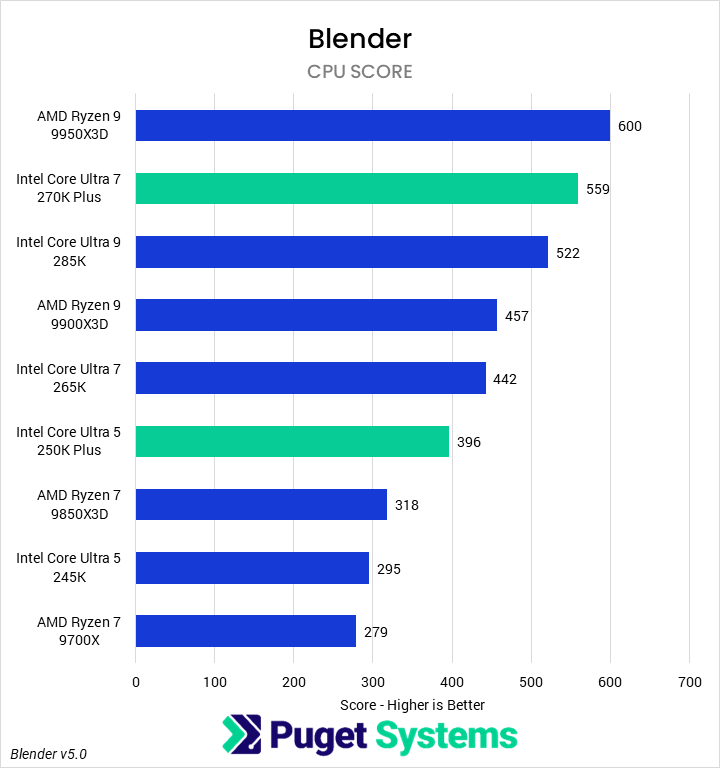
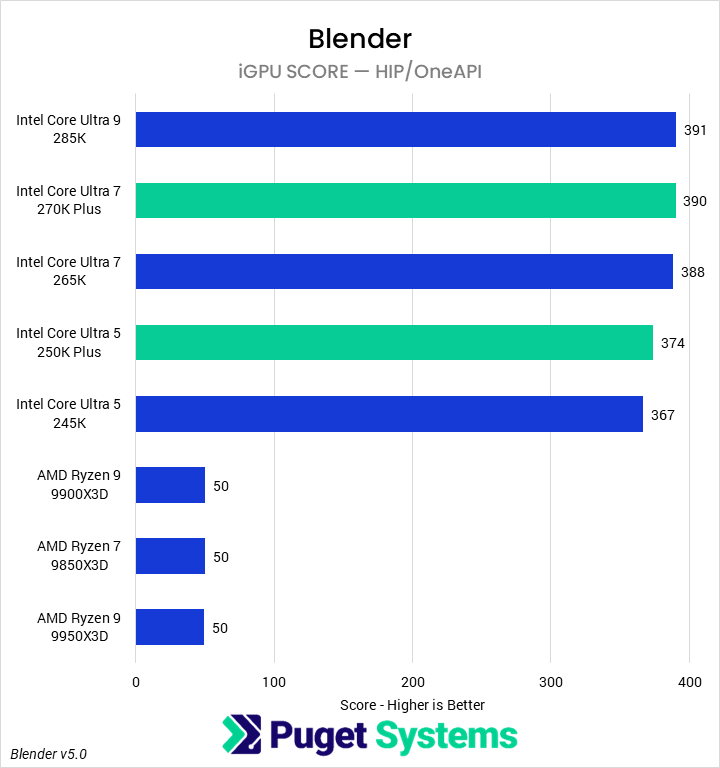
Moving on to Blender (Chart #5), we are now testing with the recently-released version 5.0 of their benchmark. We found that the 270K Plus saw large performance gains over the 265K, placing it just 7% behind the 9950X3D. It was also 7% faster than the 285K, 26% faster than the 265K, and twice as performant as the 9700X. The 250K Plus was similarly impressive, beating the 245K by 35%. Although we wouldn’t recommend rendering in Blender on the iGPU of a processor (Chart #6), we were curious if the improved memory system would have any impact on the iGPU. We found that it did not.
Intel’s new Core Ultra 7 270K Plus offers outstanding performance in CPU rendering tasks, coming within a relatively small margin of, if not actively beating, much more expensive processors such as the 9950X3D. Both it and the 250K Plus offer great performance per dollar for these tasks! That is particularly important as CPU rendering on this class of hardware would likely only be done in budget-constrained situations – since high core-count processors like Threadripper offer far better performance if the budget is available – potentially also opening up funds for a better GPU for GPU-based rendering.
AI: MLPerf & Llama Inference
As with rendering, most users won’t want to run an LLM on a CPU. Our current AI suite includes two tools:
- MLPerf, which is GPU-based, to see what impact the CPU has on performance
- An in-house Llama.cpp benchmark that runs directly on the CPU
That second test is illustrative of small-model performance which may be appropriate for running directly on this class of CPU. Unfortunately, we do not currently have a way to test the integrated NPU on Intel processors.
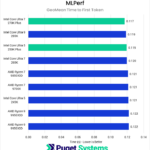
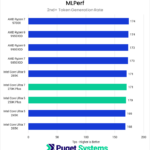
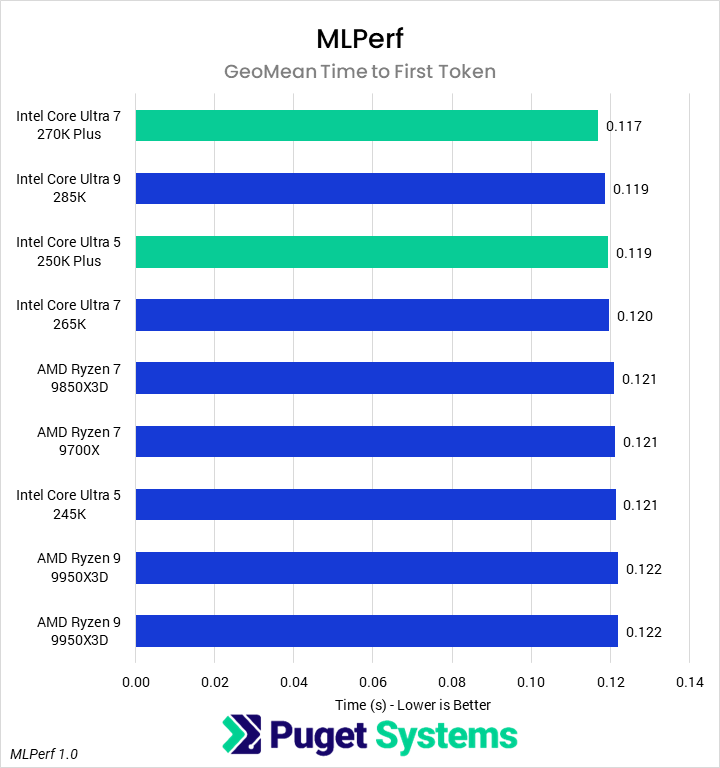
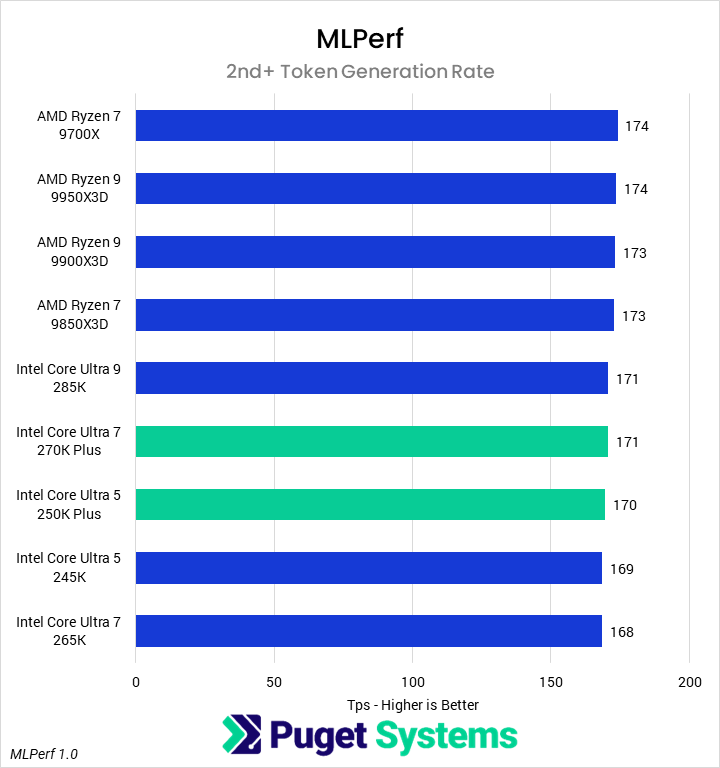
Starting with MLPerf 1.0 time to first token (Chart #1), we found little impact from the CPU. However, the 270K Plus and 250K Plus both offered improvements over the 265K and 245K, for nominal speedups. Still, we do not think that the CPU really matters here. Similarly, CPU had essentially no impact on token generation rate (Chart #2), though AMD processors were technically faster.
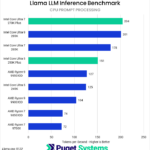
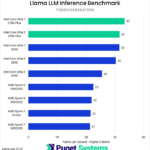
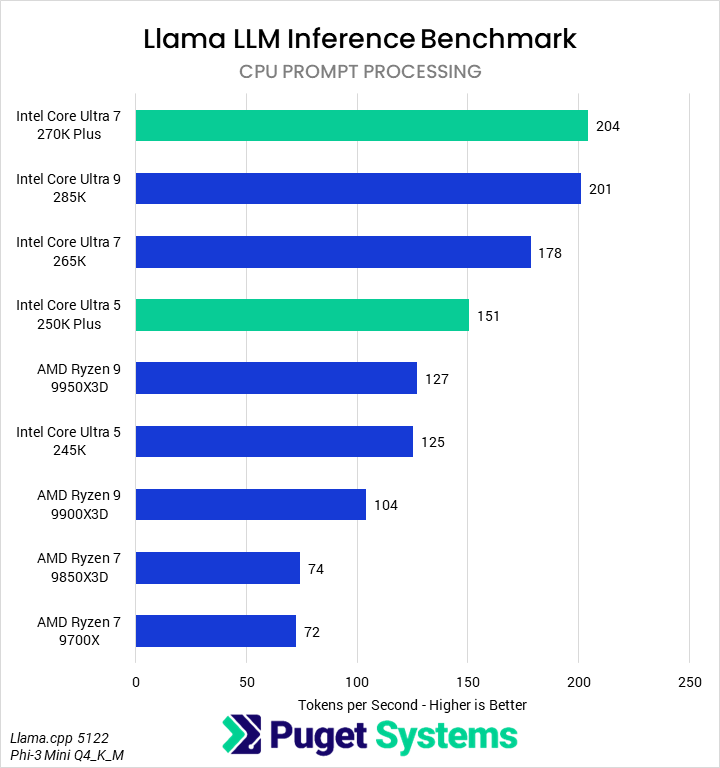
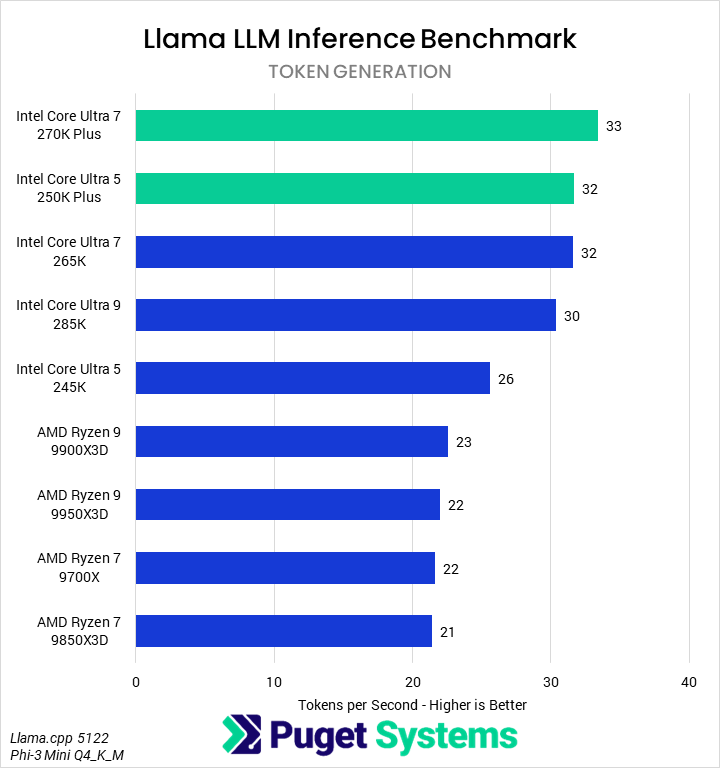
Our Llama benchmark (Chart #3) showed the 270K Plus to be the best CPU we tested, with the highest prompt processing rate of 204 tokens per second. This was just ahead of the 285K and 15% faster than the 265K. Intel’s 250K Plus saw 21% performance improvements over the 245K, making it faster than any of the Ryzen processors. In token generation (Chart #4), the Core Ultra 200S Plus processors did even better, with the 270K Plus leading the chart and the 250K Plus coming in second.
Conclusion
Intel’s new Core Ultra 7 270K Plus and 250K Plus processors are very impressive in professional workflows. The 270K Plus in particular, when combined with its support for higher-frequency memory, is often the fastest consumer-class CPU for a given workflow. When it is not, it is nearly always just behind the much more expensive 9950X3D; considering their similar prices, it embarrasses the 9700X. Likewise, the 250K Plus offers outstanding performance for its price – often competing with processors a tier (or two) above it.
For photographers and graphic designers, the Intel processors may offer something of a mixed bag. In Lightroom Classic, they were highly performant, with the 270K Plus outperforming the 285K by 4%, 265K and 9950X3D by 9%, and 9700X by 23%; it was the fastest CPU we tested. Similarly, the 250K Plus managed to match the 9900X3D. However, in Photoshop, AMD’s Ryzen processors were all faster than any of the Intel CPUs. Graphic designers may want to stick with AMD, but photographers who use both applications will have to weigh the tradeoffs.
In video editing and motion graphics applications like Premiere, DaVinci Resolve, and After Effects, the 270K Plus was consistently as fast as the 9950X3D, often nominally topping the chart. It saw, on average, a 3% performance lead over the 285K and 265K, and a 12% average advantage over the 9700X. The 250K Plus consistently performed around the 9900X3D thanks to a 9% performance increase over the 245K.
Our game developer and coding tests with Unreal Engine found the new Core Ultra 200S Plus processors to be performant but not dominant, with the 9950X3D continuing to be the fastest desktop processor for these tasks. On a budget, however, the 270K Plus and 250K Plus are unmatched. The former was only 8% slower than the 9950X3D, putting it 7% ahead of the 285K, up to 15% ahead of the 265K, and twice as fast as the 9700X. Similarly, the 250K Plus matched or beat the 9850X3D due to a 23% performance advantage over the 245K.
In rendering applications, the 270K Plus performed very well. It lead the chart in Cinebench, and came in second to the 9950X3D in Blender and V-Ray by only single-digit percentages. It averaged 23% faster than the 265K and 6% faster than the 285K. Though around the same price, the 270K Plus outperformed the 9700X by roughly 100%. The 250K Plus also saw large improvements over the 245K of about 30%, often outperforming the 9850X3D and, in Cinebench, even matching the 9900X3D.
Although we are unsure if the new Core Ultra 200S Plus processors will be as successful in the enthusiast gaming market, due to the performance and popularity of AMD’s X3D processors, Intel has cemented its lead in many professional workflows, offering outstanding performance at a great price. This is one of the best CPU releases from Intel in years.
If you need a powerful computer to tackle the applications we’ve tested, the Puget Systems workstations on our solutions page are tailored to excel in various software packages. If you prefer a more hands-on approach, our custom configuration page helps you configure a system that matches your specific needs. Or, if you would like guidance to select hardware for your unique workflow, our knowledgeable technology consultants are here to lend their expertise.
Looking for a new desktop workstation?
We build computers tailor-made for your workflow.
Don’t know where to start?
We can help!
Get in touch with one of our technical consultants today.