Table of Contents
Introduction
We recently released a pair of updates to our Puget Bench for Creators suite with 2.0 versions for both Premiere Pro and DaVinci Resolve. While most of the updates to our benchmarks don’t meaningfully change the scores, instead fixing bugs and improving compatibility, the 2.0 releases mark a big change in how they test their host applications and even what is being tested. In this article, we are going to explore how that impacts the performance of a variety of current-generation hardware in those applications and what that means for professional creators using them.

We won’t go into all the Puget Bench for Premiere Pro and Puget Bench for DaVinci Resolve changes in this post (there are a lot of them!), but we will cover some of the top-level changes to help know what to keep an eye out for. First off, changes we made to what is being tested mean that none of the overall scores or subscores are comparable between 1.0 and 2.0 versions. Moreover, the specific test scores themselves are often not comparable. For both applications, we have added NIKON N-RAW codec testing, 4x MultiStream testing, and a new “Real World” test category that mixes various encode/decode tasks and effects to represent an actual timeline.
In Premiere Pro, we removed software and HEVC encoding tests due to changes Adobe made and updated the GPU Effects tests. For DaVinci Resolve, we added ProRes Encoding and updated the AI tests; we also adjusted which tests run in the “basic” and “standard” presets. Except for the HEVC changes noted above, all of these adjustments were intended to make our benchmark more representative of what an end user would experience within the application. We are excited to see what, if any, impact they have on the relative performance of PC hardware and how that can help us and other reviewers best guide creative professionals in their system purchases.
As a reminder, all of the Puget Bench for Creators benchmarks are freely available for personal use, so anyone can download and run them on their own system. We also offer free press licenses as well as a paid license for commercial use or access to advanced features, such as CLI, local logging, beta releases, and improved support.
Test Setup (Expandable)
AMD Ryzen Test Platform
| CPUs: AMD Ryzen™ 9 9950X3D |
| CPU Cooler: Noctua NH-U12A |
| Motherboard: ASUS ProArt X670E-Creator WiFi BIOS Version: 3402 |
| RAM: 2x DDR5-5600 32GB (64 GB total) |
| GPUs: NVIDIA GeForce RTX™ 5090 NVIDIA GeForce RTX™ 5080 ASUS PRIME GeForce RTX™ 5070 Ti OC MSI GeForce RTX™ 5060 8G Ventus 2X OC Driver Version: 591.74 Sapphire Nitro+ AMD Radeon™ RX 9070 XT OC Driver Version: 22042.1 |
| PSU: EVGA SuperNOVA 1200W P2 |
| Storage: Kingston KC3000 2TB |
| OS: Windows 11 Pro 64-bit (26200) Power Profile: Balanced |
Intel Core Ultra Test Platform
| CPUs: Intel Core™ Ultra 9 285K |
| CPU Cooler: Noctua NH-U12A |
| Motherboard: ASUS ProArt Z890-Creator WiFi BIOS version: 2302 |
| RAM: 2x DDR5-6400 CUDIMM 32GB (64 GB total) |
| GPUs: NVIDIA GeForce RTX™ 5080 Driver Version: 591.74 |
| PSU: Super Flower LEADEX Platinum 1600W |
| Storage: Samsung 980 Pro 2TB |
| OS: Windows 11 Pro 64-bit (26200) Power Profile: Balanced |
AMD Ryzen Threadripper Test Platform
| CPUs: AMD Ryzen Threadripper™ 9970X |
| CPU Cooler: Asetek 836S-M1A 360mm |
| Motherboard: ASUS Pro WS TRX50-SAGE BIOS version: 1203 |
| RAM: 2x 4x DDR5-6400 ECC Reg. 32GB (128 GB total) |
| GPUs: NVIDIA GeForce RTX 5080 Driver Version: 591.74 |
| PSU: EVGA SuperNOVA 1200W P2 |
| Storage: Samsung 980 Pro 2TB |
| OS: Windows 11 Pro 64-bit (26200) Power Profile: Balanced |
Benchmark Software
| Premiere Pro 25.2 — Puget Bench for Premiere Pro 1.2 |
| Premiere Pro 26.0 — Puget Bench for Premiere Pro 2.0.8 |
| DaVinci Resolve Studio 20.3 — Puget Bench for DaVinci Resolve 1.2 |
| DaVinci Resolve Studio 20.3 — Puget Bench for DaVinci Resolve 2.0.8 |
We wanted to characterize how various hardware performed with these changes to the benchmarks, so we used a variety of platforms and GPUs—but with some things in common. First, all of our platforms had up-to-date Windows installations, drivers, and BIOSes. Second, all of them featured JEDEC RAM running at their maximum supported frequencies, overclocking features were disabled, and VBS and ReBar were enabled. Finally, all of our GPU testing was performed on AMD Ryzen™ 9950X3D-based platforms.
We benchmarked DaVinci Resolve using Resolve version 20.3 and Puget Bench for DaVinci Resolve versions 1.2.2 and 2.0—but we will only be examining how scores are affected by the updated test suite. However, for Premiere Pro, we used two different versions of both the app and benchmark: application versions 25.2 and 26 with benchmark versions 1.1.1 and 2.0, respectively. This is because versions of Premiere prior to 25.6 are not supported by the 2.0 release, nor are later versions by the 1.1.1 release, due to changes Adobe made to HEVC support. This means our analysis of the Premiere Pro benchmark update will not only see the changes between the benchmarks, but also application versions.
Puget Bench for Premiere Pro
For this analysis, we started our testing with Premiere Pro. This was the more complicated of the two benchmarks, as there is no in-common version of Premiere Pro shared between the 1.x and 2.x benchmarks. This is due to the removal of script-based HEVC exporting from Premiere Pro versions after 25.2. At the same time, we added a number of new GPU effects that are both heavier and, we believe, more representative of typical use cases, which are not available on Premiere Pro versions older than 25.6. One additional quirk is that full NVIDIA Blackwell GPU support was added to Premiere Pro with version 25.3. Therefore, the differences we will see are due to a mix of differing hardware support, general application performance changes, and the new blend of tests in Puget Bench for Premiere Pro 2.0.
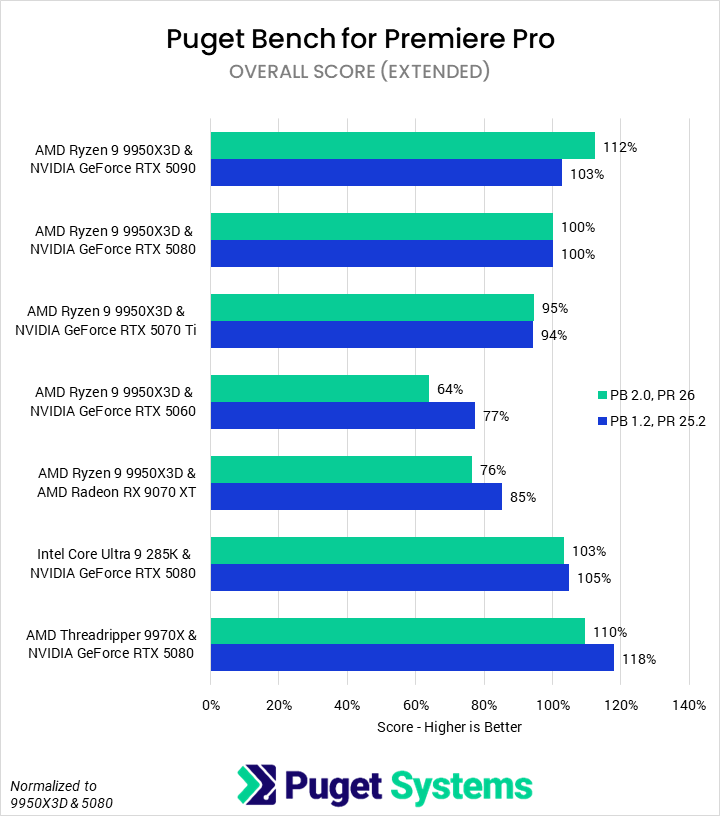
Beginning with the Overall score (Chart #1), we saw that the 2.0 benchmark discriminates between configurations better than the 1.0 benchmark, with the range changing from -23% to +18% to -36% to +112%. Though difficult to tell based only on the Overall score, it seems that the GPU now impacts performance more than the CPU, at least in the upper tier of enthusiast parts. The overall rankings remained relatively consistent, with the AMD Threadripper™ 9970X & NVIDIA GeForce RTX™ 5080 going from the best configuration to the second best, just a touch slower than the AMD Ryzen™ 9950X3D & RTX 5090. Previous hardware recommendations made for the 1.0 version are likely still accurate, though they may differ slightly.
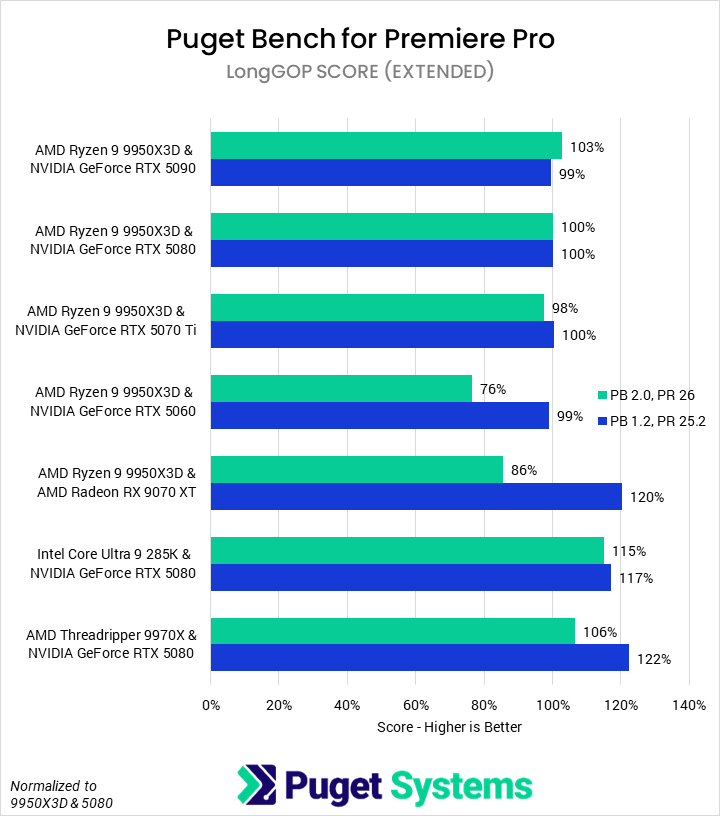
LongGOP tests (Chart #2) are one of the subsets that saw the most change between benchmark and application versions. The most immediate difference between the 1.0 and 2.0 results is that the AMD Radeon™ RX 9070 XT went from being better than a 5090 to being notably worse. Digging into exactly why is difficult, but we found at least two contributing factors. First, support was added for the 50 Series’ media engines to accelerate more codecs (especially 4:2:2 10-bit). Second, CPU-based software encoding tests were eliminated—which, for unknown reasons, AMD CPUs often performed better in when equipped with AMD’s own GPUs than with NVIDIA’s. That’s not to say that the AMD card offers no advantages—we still found it faster than the 5090 in single-stream H.264/HEVC processing workloads—but it is certainly behind NVIDIA due to the full Blackwell support Adobe now offers.
Speaking of single-stream encoding, one side note is that we saw no benefit from having multiple NVENC or NVDEC encoders on an NVIDIA GPU in Premiere Pro, suggesting they haven’t fully enabled parallel stream processing that is supported in hardware. We also see an interesting advantage for Intel, with their Quick Sync media engine outpacing NVIDIA in HEVC workloads, while maintaining near parity in H.264 workloads. End users will still have to weigh the potential CPU-based performance gains of a top-end Ryzen versus the media-processing gains of an Intel CPU.
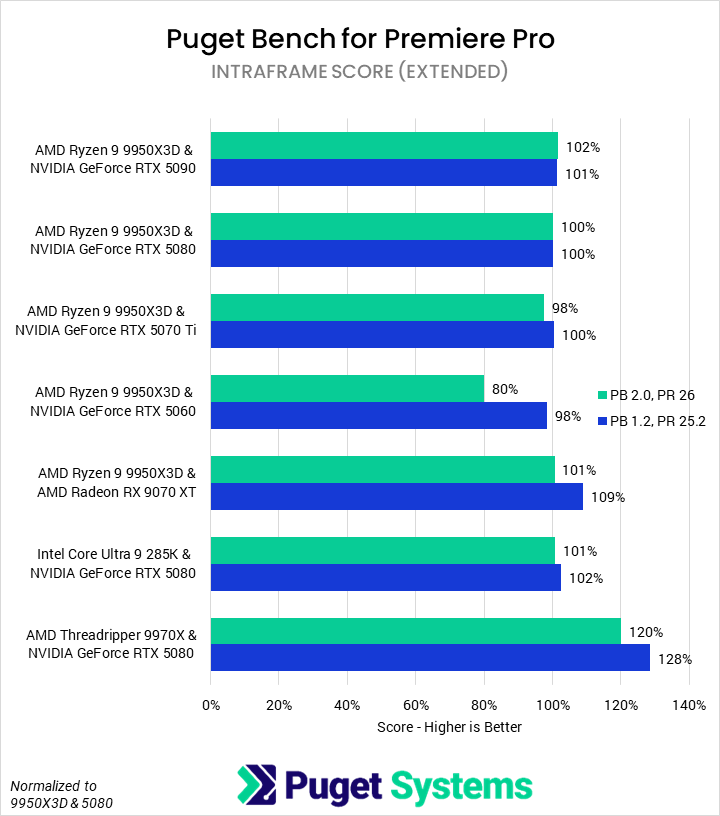
Compared to interframe (H.264/HEVC), our Intraframe tests (Chart #3) saw relatively little change. The 9970X and 9070 XT test platforms each drop a bit of performance relative to the 9950X3D & 5080 setup, but both still outperform it. However, the GeForce RTX™ 5060 goes from near parity to substantially behind. This is actually a trend we saw in almost every subtest, and we believe that it is due to the card’s VRAM constraints: 8 GB is simply not enough VRAM to keep up with modern video editing workflows. Otherwise, Intraframe continues to prefer pure CPU performance.
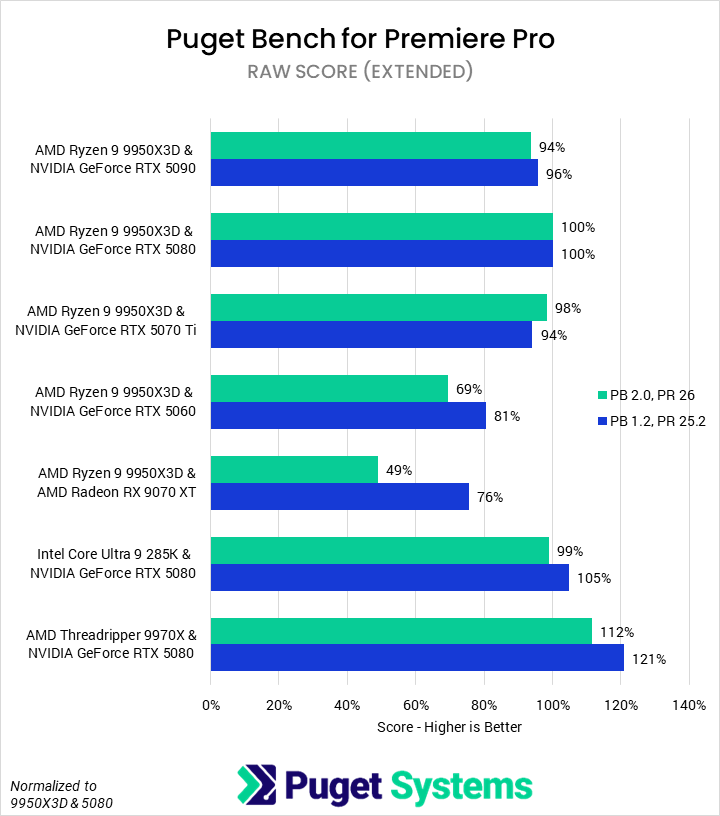
Moving on to the RAW codec tests (Chart #4), we saw few changes in relative performance. The only two of real note were the 9070 XT and the 5060. We found that the 9070 XT performed very poorly in the CinemaRawLight test in the new benchmark/application version, which we had not previously seen. We need to look into this further, but it is likely due to a bug in Premiere Pro 26.0. The 5060, on the other hand, was crippled by the heavy 4K RED 4x MultiStream test, again due to a lack of VRAM. Technically, the 9970X also lost about 9% relative performance, though we believe this is mostly due to added tests that increase the importance of the GPU.
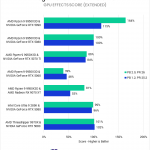
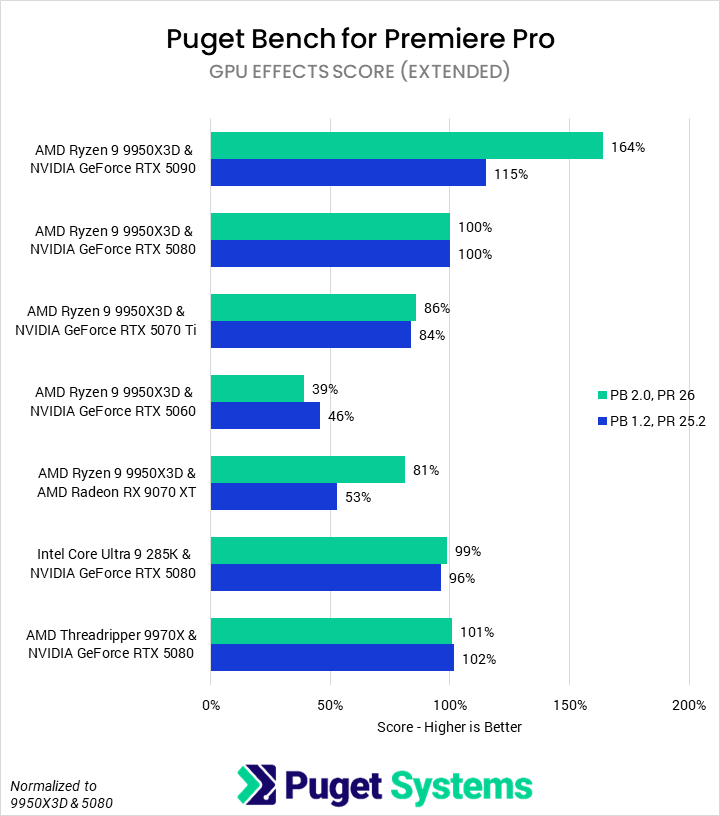
Finally, we tested GPU effects (Chart #5). Like LongGOP, this test category saw a large overhaul, with three of the previous five tests dropped and four new tests added. The new tests represent a more modern video editing workflow, and we believe them to be generally harder on GPUs based on our results: the 5090 saw large performance improvements over the 5080, while the 5070 Ti and 5060 scored relatively worse. We also saw that the 9070 XT performed much better in the new version, as it does well with many of the new GPU effects.
Puget Bench for DaVinci Resolve
Unlike with Premiere Pro, the Puget Bench for DaVinci Resolve 1.x and 2.0 benchmarks share application version support. We were able to test both on DaVinci Resolve version 20.3, to simplifying our comparisons. Any differences in relative performance are thus due to the changes in what the benchmarks are testing. As a reminder, we added new codecs and MultiStream tests, and adjusted the AI tests to better represent the tools available in Resolve.
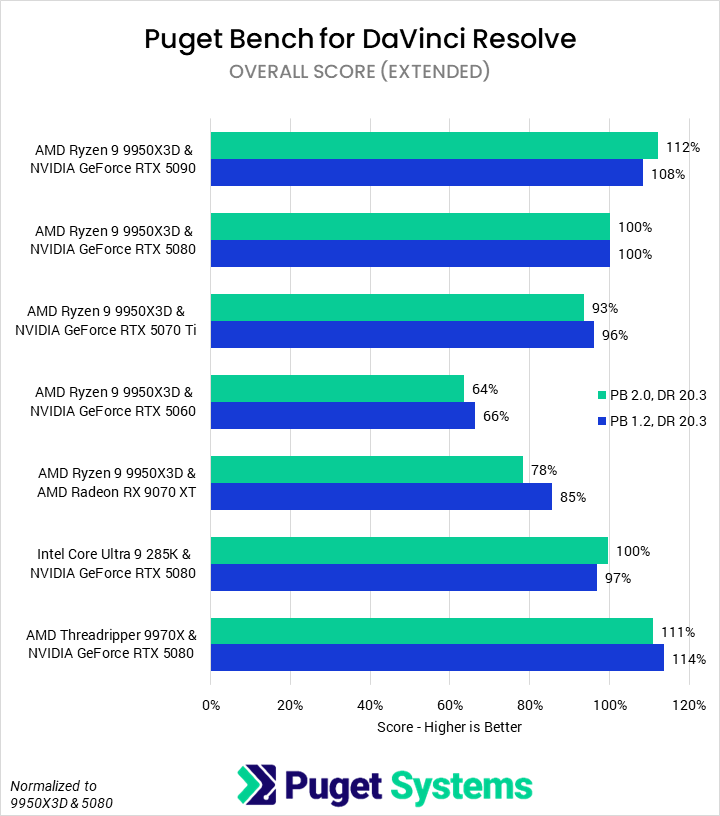
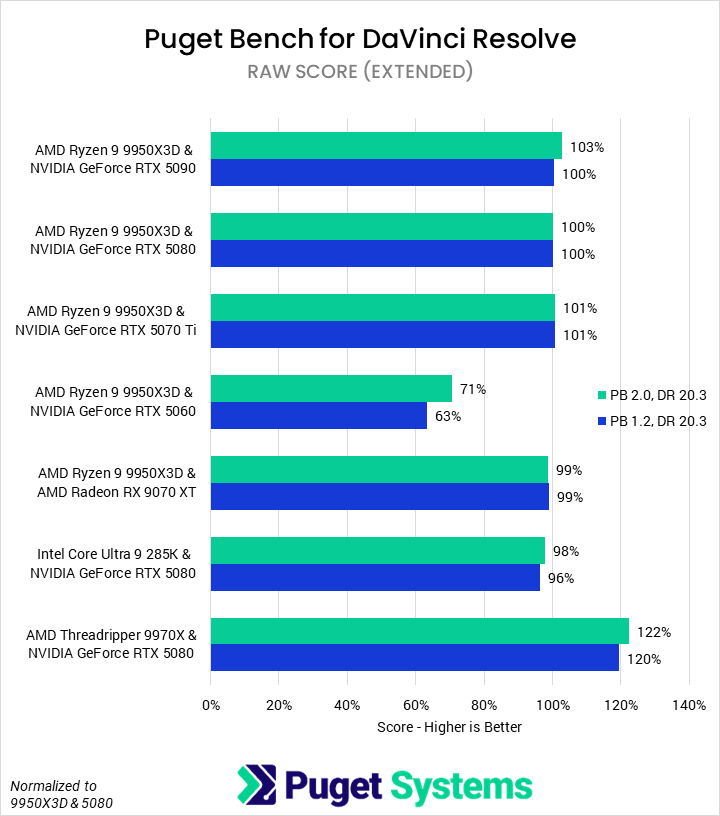
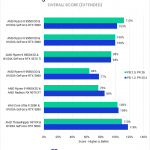
Starting with the Overall score (Chart #1), we see that—similar to Premiere—there is now a larger spread between GPUs but a smaller spread based on CPU. However, the effects are less dramatic, with most configurations only changing by a few percent. DaVinci Resolve has historically been better accelerated than Premiere Pro and, combined with full hardware support in both the new and old benchmarks, should be less sensitive to the benchmark changes. The only change in position between the tested platforms was the combination of 9970X and 5080 going from just ahead of the 9950X3D with 5090 to just behind it.
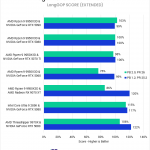
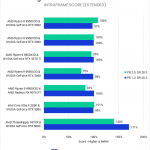
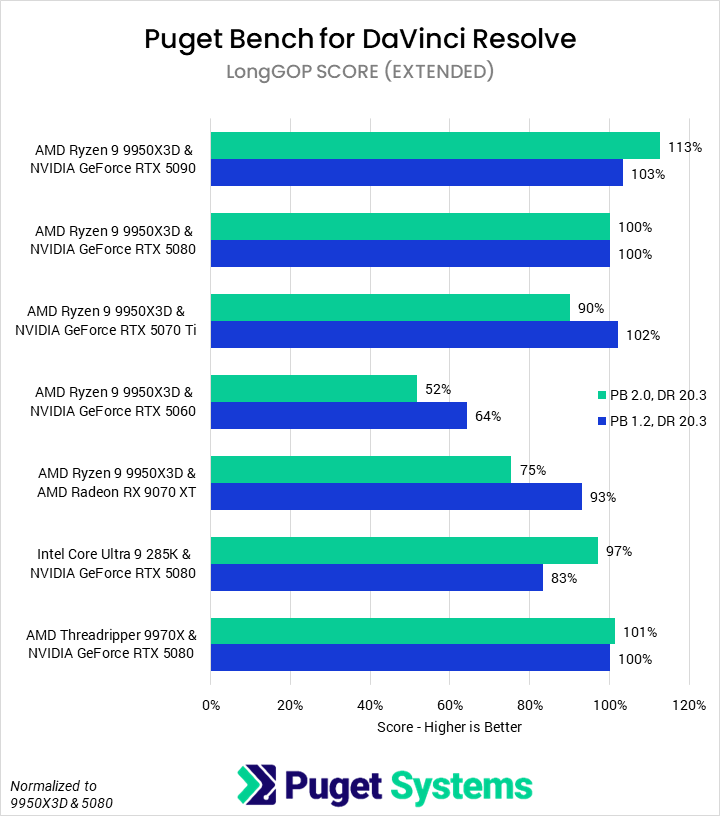
Next up were the LongGOP codec tests (Chart #2). Scores in here were fairly stable overall, but we did see movement in the various NVIDIA GPUs, with them better differentiating by tier. AMD’s Radeon RX 9070 XT also took a large relative hit, as did the GeForce RTX 5060 and Threadripper 9970X. The differentiation between tiers of NVIDIA GPUs is due to the addition of MultiStream tests, as DaVinci Resolve supports parallel NVENC/NVDEC usage for multi-cam sequences. Thus, the higher-end cards, with more NVENC/NVDEC engines, perform better; we may explore this more in a future article. This is also why the 9070 XT relatively dropped so much, as it does not support this feature. The 5060 not only has fewer media engines and also exceeded its VRAM in multi-stream and our “real world” tests, demonstrating that 8 GB cards are no longer suitable for professional content creation. As to the 9970X, raw CPU performance is less important in the new benchmark as there are more hardware-accelerated tests.
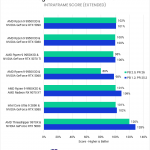
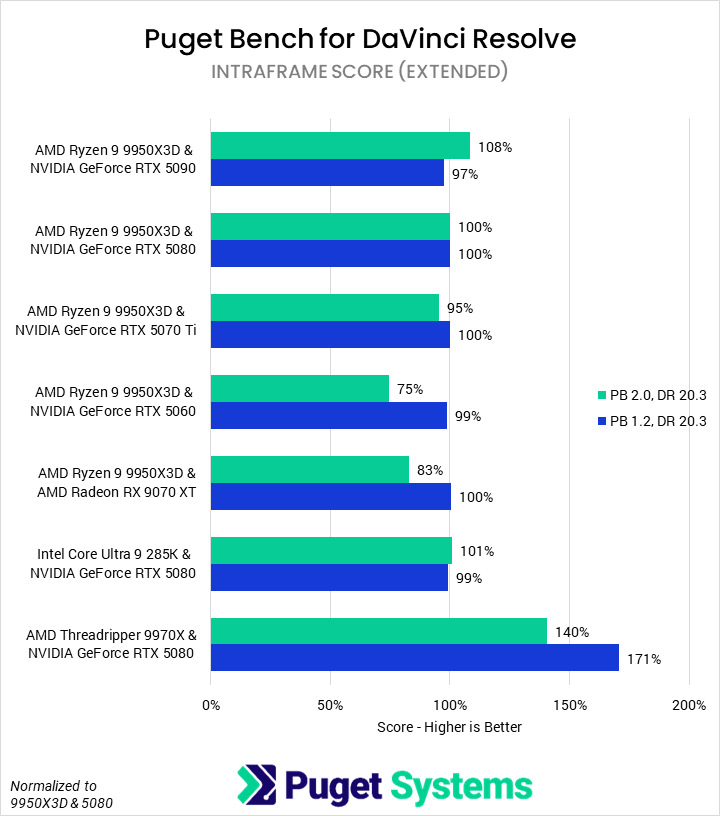
Intraframe codecs (Chart #3) showed very similar behavior. The 5060 and 9070 XT both struggled somewhat with the Real World tests, dragging down their relative performance. Beyond that, scores are fairly stable with the exception of the 9970X. AMD’s Threadripper part is still faster than any of the other processors, but due to the inclusion of more tests that are less CPU-dependent, it is relatively less good.
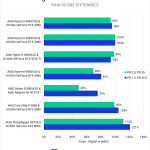
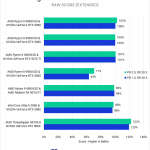
Although we added Nikon N-Raw and RED MultiStream testing to our RAW codecs tests (Chart #4), we saw virtually no change to this category’s score between cards. It seems that, in DaVinci Resolve, those tests scale almost identically to the pre-existing RAW codecs we test with, and so had little impact on relative performance.
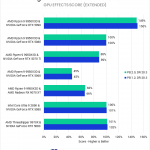
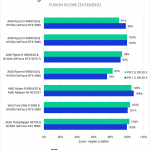
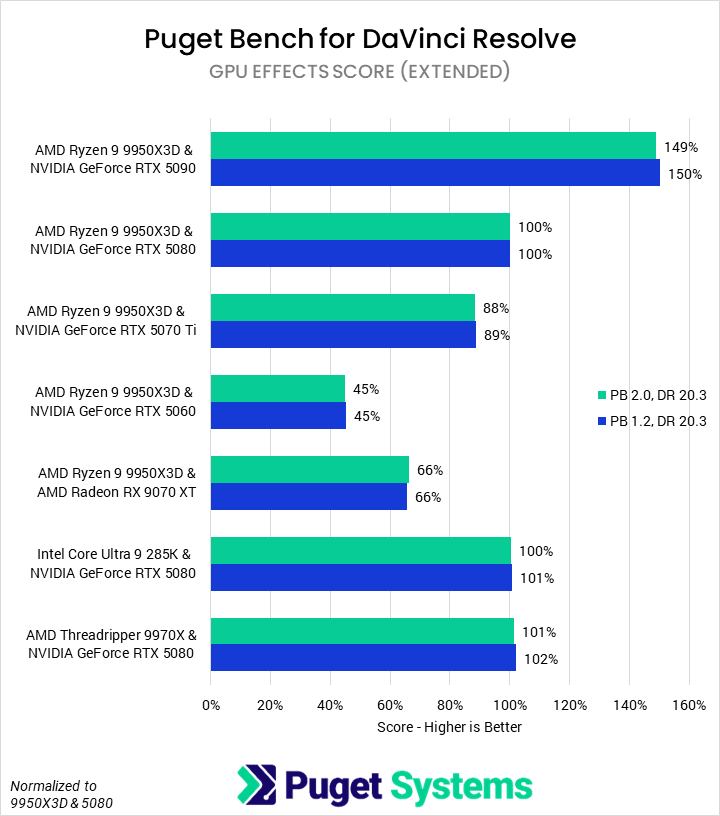
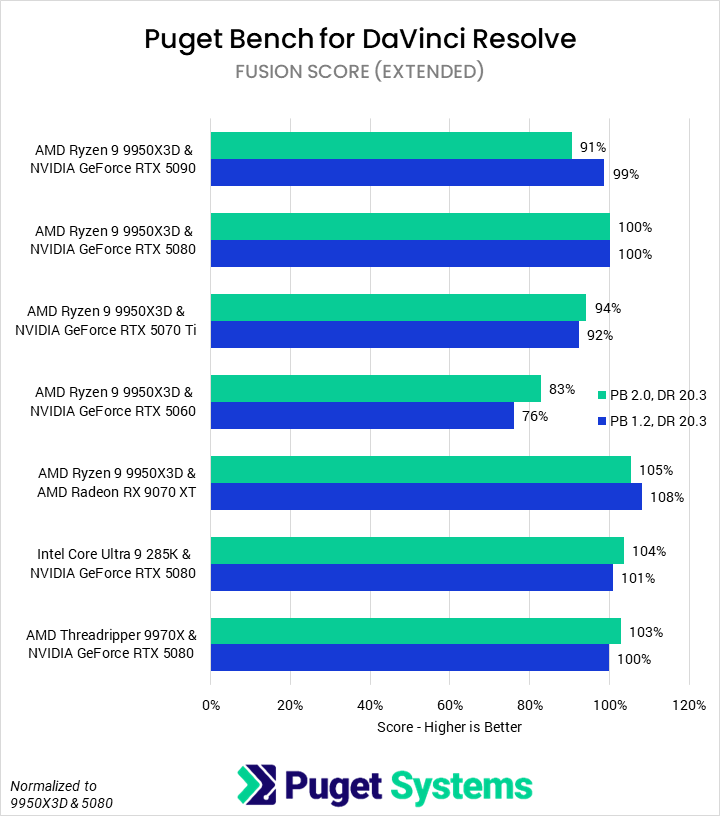
Neither GPU Effects (Chart #5) nor Fusion (Chart #6) changed at all with the benchmark update, so we did not expect to see any score differences. Interestingly, while this was the case for GPU effects, we did see some variation in Fusion scores. Although we are confident that our results have a low margin of error—we ran over a dozen loops of the benchmarks—we did observe a high amount of run-to-run variance in our Fusion results. We plan to keep an eye on Fusion performance going forward, but for now, we are assuming that we are just seeing noise.
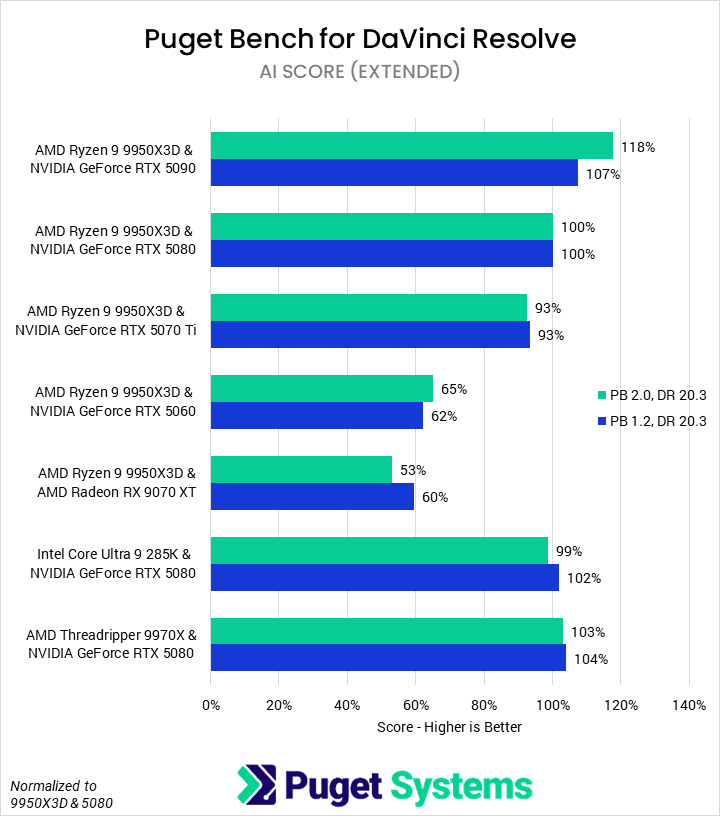
AI tests (Chart #6) are the final area we test in DaVinci Resolve. We did adjust some of these tests in the shift to the 2.0 benchmark version, and we saw changes in relative performance due to that. Overall, there was more discrimination between GPUs, with the 5090 appearing much better relative to the 5080 than previously. Depth Map v2 and Super Scale (2x Enhanced) both allow the larger GPU to stretch its legs and increase the performance delta between it and other cards. Unfortunately for AMD, the 9070 XT is slower relative to NVIDIA in Magic Mask v2 Tracking compared to the test it replaced.
How Do Overall Scores Correlate with Real-World Performance?
Although we try to break down subscores (and even individual tests, when applicable) to help users understand how their software interacts with their hardware, we still include “Overall” scores to give a good idea of how, across the entirety of the application, a specific component performs. Ideally, this Overall score closely maps to real-world performance an end user would see. Now that we have added three tests to our benchmark, which are essentially real-world projects, we have a good way of testing how closely our blended Overall score aligns with performance in a realistic project timeline. Below, we created a table which shows the mean relative performance difference across all tested configurations between the preset’s “Overall” score and the averaged “Real World” test performance. Essentially, a lower percentage correlates to a closer correspondence between the “Overall” score and the “Real World” tests.
| Mean Difference from "Real World" Tests Geomean | Overall Score (Basic) | Overall Score (Standard) | Overall Score (Extended) |
|---|---|---|---|
| Premiere Pro | N/A | 3.5% | 2.2% |
| DaVinci Resolve | 16.1% | 9.8% | 8.4% |
We found that our overall scores in Premiere Pro map tightly to the “Real World” tests, with an average difference of only 2-3%. This means that, with the margin of error of a single benchmark run, the “Real World” tests could act interchangeably with the overall scores for ranking hardware across the breadth of Premier Pro.
That wasn’t the case for DaVinci Resolve, which saw much larger differences, especially for the “Basic” preset. Still, 8-10% is fairly close and encourages us that the Overall (Extended) score is an acceptable proxy for real-world performance, while allowing us to also focus in on a specific aspect of a workflow (GPU effects, codec processing, etc.) for a more detailed analysis. However, we would urge some caution, as we found that certain cards—such as the RTX 5060 and RX 9070 XT—were far less performant in the Real World tests than their Overall scores would suggest.
When we design our benchmarks, our primary focus is to capture the breadth of workflows creative professionals use with the best accuracy we can. We believe that a good benchmark is accurate, precise, and reflective of the use case. To that end, we do relatively little comparative performance testing during development—so it is fascinating to see how the inclusion of more modern workflows, codecs, and application tools can affect what components exhibit the best performance.
If you need a powerful computer to tackle the applications we’ve tested, the Puget Systems workstations on our solutions page are tailored to excel in various software packages. If you prefer a more hands-on approach, our custom configuration page helps you configure a workstation that matches your needs. Otherwise, if you would like more guidance in configuring a workstation that aligns with your unique workflow, our knowledgeable technology consultants are here to lend their expertise.
Looking for a new desktop workstation?
We build computers tailor-made for your workflow.
Don’t know where to start?
We can help!
Get in touch with one of our technical consultants today.