Table of Contents
Introduction
Earlier this year, AMD and NVIDIA each launched a new generation of graphics cards; Intel had done so just a month prior. However, due to rolling model releases and poor application support, we had not yet had the chance to test all of them on even footing. More than half a year has passed now, giving time for manufacturers to optimize drivers and developers to release compatible apps, so we wanted to finally see how they all stack up.

Image
For this round of testing, we decided to look at almost every model from the last two generations of AMD, Intel, and NVIDIA consumer-class video cards. This lets us see both comparative performance between manufacturers and generational gains. There are a lot of potentially interesting comparisons to make here! We think the most relevant ones are NVIDIA’s gen-over-gen, between the GeForce RTX™ 5090 and 4090 as well as the RTX™ 5080 and 4080 SUPER, and then current-gen competition between the AMD Radeon™ RX 9070 XT and NVIDIA GeForce RTX™ 5070 along with the Intel® Arc™ B580 versus NVIDIA GeForce RTX™ 5060.
Test Setup
Test Platform
| CPUs: AMD Ryzen™ 9 9950X3D |
| CPU Cooler: Noctua NH-U12A |
| Motherboard: ASUS ProArt X670E-Creator WiFi BIOS Version: 2604 |
| RAM: 2x DDR5-5600 32GB (64 GB total) |
| PSU: Super Flower LEADEX Platinum 1600W |
| Storage: Samsung 980 Pro 2TB |
| OS: Windows 11 Pro 64-bit (26100) Power Profile: Balanced |
Intel GPUs
| Intel® Arc™ B580 LE Intel® Arc™ A770 LE Intle® Arc™ A750 LE Driver: 101.7026 |
NVIDIA GPUs
AMD GPUs
Benchmark Software
| Premiere Pro 25.2.3 — PugetBench for Premiere Pro 1.1.1 |
| After Effects 25.3.2 — PugetBench for After Effects 1.0 |
| DaVinci Resolve 20.0 — PugetBench for DaVinci Resolve 1.2.0 |
| Topaz Video AI 7.0.2 |
| Unreal Engine 5.5 |
| Blender 4.5 |
| V-Ray 6.00.01 |
| Redshift 2025.6 |
| OctaneBench 2025.2.1 |
| MLPerf Client v1.0 |
| Unigine Superposition 1.0 |
At present, we do all of our video card testing on an AMD Ryzen™ 9 9950X3D-based platform. We have found that the 9950X3D gives the best all-around performance for our most commonly run benchmarks. This helps ensure that the GPU is the primary bottleneck insofar as possible. We used the latest available drivers as of the time we started testing, but we have been working on this roundup for some time, so they are no longer the most up-to-date drivers. The software packages we utilized are pretty typical for our GPU reviews, including most of our PugetBench suite, our in-development Unreal Engine benchmark, and a variety of industry-standard third-party benchmarks.
Premiere Pro


The first benchmark we tested with was PugetBench for Premiere Pro. Due to recent updates to Premiere removing automation for certain codec exporting, we decided to stay on the slightly older version 25.2.3. However, this does mean that hardware-accelerated encoding and decoding of 10-bit 4:2:2 media is not enabled for the NVIDIA 50 Series GPUs. This will negatively impact their performance somewhat from what a user on 25.3 or newer would see with those codec variants.
Beginning with the Overall score (Chart #1), we found that NVIDIA’s GeForce RTX 5090 was the fastest GPU, followed by the 4090 and 5080. AMD first appears near the middle of the pack, with the Radeon RX 7900 XTX and 9070 XT approximately matching the RTX 3090 Ti and trailing just behind the RTX 5070. Intel is even further behind, with the Arc A770 5% slower than the RTX 5060, and the B580 only outperforming the RTX 4060 and 4060 Ti.
Long GOP/Interframe codecs (Chart #2) are the first subscore we look at. In those tests, AMD’s cards were the fastest by a healthy margin, with the Radeon RX 9070 XT 25% faster than the 50 Series NVIDIA cards. Newer versions of Premiere will likely narrow or eliminate this gap, but AMD should still remain faster in the 8-bit 4:2:0 HEVC and H.264 codec flavors. Intel’s Alchemist cards were in the middle of the pack in these tests, behind NVIDIA’s 50 Series but ahead of previous generations. However, the B580 was the slowest card tested, as the decoding speed was noticeably lower than the Alchemist GPUs—we’re not sure why this is the case.
We typically don’t consider Intraframe (Chart #3) to be GPU-dependent, but we have seen that systems with an AMD GPU have a performance advantage. We suspect it has to do with the OpenGL pipeline, but we haven’t investigated further. RAW media (Chart #4) is partially GPU-accelerated, and we found that NVIDIA outperformed the competition here. However, there is a lot of noise in the data, so it is hard to draw too many conclusions about the performance.
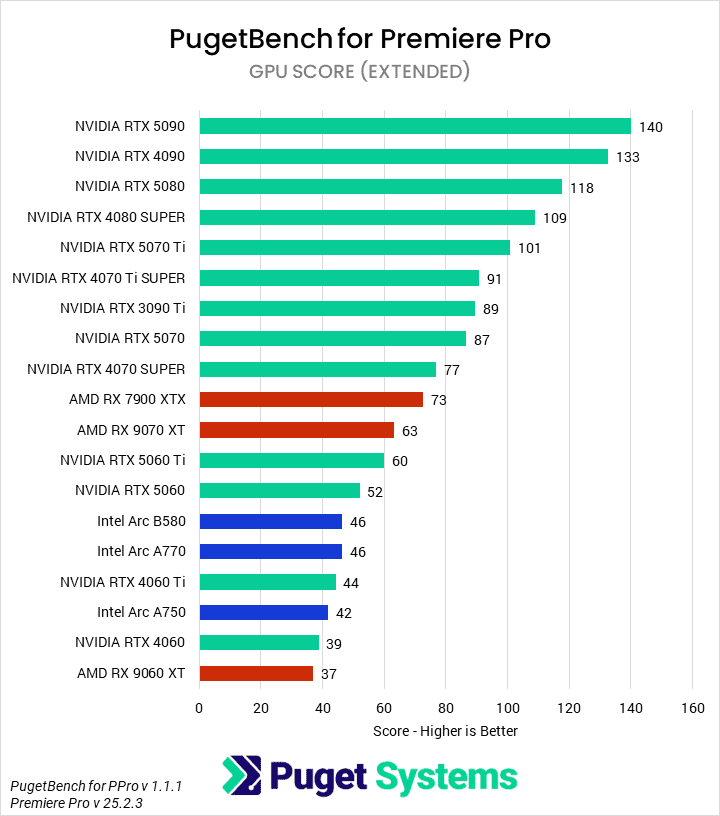
Finally, GPU effects (Chart #5) are, as would be expected, almost wholly reliant on GPU performance. We found that the GeForce RTX 5090 led the pack, followed by the 4090 and 5080. We don’t see any competitor’s GPU until the Radeon RX 7900 XTX, which slotted in just behind the 4070 SUPER. The 9070 XT was roughly equivalent to a 5060 Ti. Intel is even further behind, with the Arc B580 tying their A770, both sandwiched between the 5060 and 4060 Ti.
After Effects


Traditionally, After Effects has been an area of strength for NVIDIA, especially when the application began adding 3D workflows. However, recent versions of After Effects appear to have fixed a bug that was holding back performance with AMD GPUs. This is shown in our 2D (Chart #2) and Tracking (Chart #4) workflow tests, where there is practically no difference between GPU manufacturers or models.
In 3D workflows (Chart #3), however, there is still differentiation. NVIDIA performs very well here, with the GeForce RTX 5090, 5080, and 5070 Ti taking the top three spots. We see a generational improvement of 15-35% for the 50 Series cards over the prior 40 Series. AMD and Intel do very poorly, with even the top-end cards from those brands having only half the performance of the 4060. We suspect there is some potential for optimization here from Adobe, as this is out of line with most other 3D graphics and compute results.
DaVinci Resolve Studio


The next benchmark in our GPU suite is DaVinci Resolve. Unlike Premiere, the current version of Resolve fully supports NVIDIA’s Blackwell architecture and automated HEVC exporting – so we were particularly interested in seeing how LongGOP performance differs from Premiere Pro. However, there is a known bug with Intel Battlemage cards that prevents them from properly completing the PugetBench for DaVinci Resolve benchmark. We hope a fix will come soon, but for now, we left the Arc B580 on the charts with a 0 for ‘did not complete’.
Starting with the Overall Score (Chart #1), we found that the NVIDIA GeForce RTX 50 Series GPUs saw a roughly 10% improvement over the 40 Series. This means that the RTX 5090 was the fastest GPU we tested, followed by the 5080 and then 4090. AMD performed well here with its last-gen card, the Radeon RX 7900 XTX, matching the RTX 4080 SUPER. The 9070 XT was 14% slower, barely beating out the RTX 4070 SUPER.
In our LongGOP testing (Chart #2), NVIDIA’s media engines propel the 50 Series cards to the top of the chart. Curiously, we found that the Radeon RX 7900 XTX was faster than the 9070 XT, despite the 9000 Series AMD cards seeming to have better encoders in Premiere Pro; perhaps Blackmagic Design needs to do more optimization. Intel’s Arc cards were also particularly slow.
Unlike in Premiere, we saw virtually no difference in Intraframe codecs (Chart #3) by GPU manufacturer. These codecs continue to be principally CPU-bound. The RTX 4060 and 4060 Ti do seem to have negatively impacted performance, though. Meanwhile, the RAW codec tests (Chart #4) showed more differentiation on the low end. There was little difference between NVIDIA and AMD 7000 Series GPUs or higher, but below that, we saw noticeable performance degradation. The Arc A770 and Radeon RX 9060 XT were roughly equivalent, and ahead of the RTX 4060 and 4060 Ti.
GPU Effects (Chart #5) performance tends to scale with pure GPU compute. In these tests, we found that the GeForce RTX 5090 was once again the fastest card, with a healthy 34% margin over the 4090. Both the 5060 and 5060 Ti had similar generational gains, while the rest of the 50 Series was about 17% faster than their last-gen counterparts. AMD’s Radeon RX 7900 XTX matched the RTX 4080 SUPER, while the 9070 XT placed between the 5070 and 4070 SUPER. Intel’s best card was the Arc A770, just 8% behind the 5060.
Much like After Effects, Fusion (Chart #6) is typically CPU-bound. However, we did see some differentiation by GPU. The Radeon RX 7900 XTX and 9070 XT lead the chart, while the 9060 XT trailed a bit. The bulk of the middle was assorted NVIDIA GPUs. Only once we started getting into the lower-end NVIDIA cards—and Intel GPUs—did we start seeing significant performance impacts.
Finally, AI workflows (Chart #7) are solidly in NVIDIA’s favor. Intel Arc cards take up the bottom slots, with the RTX 4060 and AMD Radeon cards right above them. However, despite its large lead over competitors, NVIDIA failed to make much generational gains; only the RTX 5060 and 5060 Ti were meaningfully faster than their last-gen variants.
Topaz Video AI

Image
In Topaz Video AI, we run the built-in benchmark at 1080p and 4K, and then take a geometric mean of all of the results in order to generate a score. The GeForce RTX 5090 was the fastest GPU we tested, with 19% gen-on-gen improvement over the 4090. This was one of the largest gains, as the rest of the 50 Series family saw 5-10% uplifts. AMD also did very well here, with the Radeon RX 9070 XT tying the RTX 5080, and the last-gen 7900 XTX matching the RTX 5070 Ti. However, Intel did less well, with all three of its Arc GPUs sandwiched between the RTX 4060 and 5060.
Unreal Engine & Unigine


Our Unreal Engine benchmark renders three different scenes, each focused on a different set of features such as Nanite and Ray Tracing, at three different resolutions. This allows us to examine the performance from many different perspectives. Here, we calculated FPS averages by resolution and rasterization versus hardware ray tracing, in addition to an overall FPS average.
When combining all the scenes into an Overall FPS (Chart #1), we found that the GeForce RTX 5090 was, unsurprisingly, the fastest GPU. It was 11% faster than the last-gen 4090. Unfortunately for NVIDIA, the rest of the 50 Series line did not have consistent uplifts over the last-gen parts. Some, like the 5060, had an impressive 20% gain, while others, like the 5070, were slower. AMD’s Radeon RX 9070 XT performed well, matching the RTX 5070 Ti and beating the last-gen 7900 XTX. However, AMD’s lower-end 9060 XT barely beat the RTX 4060 Ti, while Intel’s Arc cards were at the bottom of the pack.
There is little variance in overall performance rankings by resolution (Charts #2 – 4). When looking at Ray Tracing (Charts #5 & 6), though, we did see some movement. Specifically, AMD’s cards each moved up one or two slots in their rasterized performance compared to their RT performance. We’ve known that NVIDIA traditionally has an advantage in ray tracing hardware, and we saw that here. Intel doesn’t have the same issues, suggesting that those cards may have a more robust ray tracing configuration compared to their general rasterized capabilities.
We also ran the Unigine Superposition 1.0 benchmark and, since we don’t have any other real-time renderers, decided to include it in this section. As expected, NVIDIA’s top-end GPUs performed very well, but we were surprised to see that both Intel and AMD’s cards did relatively better in this engine than in Unreal.
GPU Rendering: Blender, V-Ray, Redshift, & Octane


Unfortunately, GPUs other than NVIDIA’s are relatively unsupported in most offline renderers. Of the four we routinely test, only Blender has implemented support for Intel and modern AMD cards. Even with Blender (Chart #1), though, we found that NVIDIA dominates the chart. The GeForce RTX 5090 was 29% faster than the 4090. Curiously, though, the rest of the 50 Series cards essentially match their previous-gen counterparts. AMD first manages to make the chart with the Radeon RX 7900 XTX, sandwiched between the RTX 5060 Ti and 4060 Ti, while the remaining Radeon and Intel Arc cards make up the bottom 5 entries.
The rest of the rendering engines we tested only support NVIDIA GPUs at present. In V-Ray CUDA (Chart #2), 50 Series cards were 20% faster on average than their 40 Series counterparts. This increased to 30% in V-Ray RTX (Chart #4). Redshift (Chart #5) had smaller gains, with an average of about 7%. However, the Redshift benchmark stops being properly representative when the time to completion approaches 60 seconds. Finally, Octane (Chart #5) had similar behavior to Blender: the RTX 5090 was 23% faster than the 4090, but the rest of the 50 Series cards were essentially on-par with their 40 Series equivalents.
MLPerf Client


System Image
MLPerf Client is a newer addition to our testing lineup and looks at performance in a variety of AI models. Starting with the Mean Time to First Token (Chart #1), we found that the Intel Arc GPUs were actually the fastest! We were running them with the included OpenVino toolkit, but it is still impressive. Ultimately, though, even a 0.5-second delay is probably acceptable for most use cases.
Moving on to the 2nd+ Token Generation Rate (Chart #2), the NVIDIA GeForce RTX 5090 is once again the leader. It showed a 27% generational uplift over the 4090, while the rest of the 50 Series averaged closer to 10%. The first non-NVIDIA GPU was the AMD Radon RX 7900 XTX at 127 tokens per second, just ahead of the RTX 5070. The 9070 XT was just behind those, effectively tied with the 4070 SUPER. Intel’s Arc B580 follows after that, with 96 tokens per second, beating the RTX 5060 Ti and 5060.
Conclusion
Given the sorry state of application support at the launch of the NVIDIA GeForce RTX 50 Series, it is good to see that most professional applications now fully support those GPUs. Unfortunately, a number still don’t support Intel Arc or AMD Radeon, and many that do seem unoptimized for those architectures. We have seen Intel work with ISVs like Blender and MLCommons to integrate optimizations for their GPUs, so we hope they will continue those efforts in other areas.
Overall, we found that the NVIDIA GeForce RTX 5090 was the fastest GPU on the market. Given its status as the halo product of the most recent generation, we’re not surprised by this. It typically saw performance gains of about 30% over the last-gen 4090, though this varied a lot by workflow. However, the rest of the 50 Series was much less impressive. On average, they were about 10% faster than the previous-gen.
Both AMD and Intel have competitive options in the low end. AMD’s Radeon RX 9070 XT frequently struggled to match AMD’s prior-gen 7900 XTX, but these exist at totally different price points. Instead, it was frequently a better value than the GeForce RTX 5070, though with some caveats. NVIDIA still rules offline renderers, and AMD’s architecture struggles with some parts of NLEs, while dominating at others. Intel, meanwhile, managed to stay largely competitive in performance per dollar with the GeForce RTX 5060. However, it rarely managed to actually outperform it, or sometimes even the older 4060.
Looking for a content creation workstation?
We build computers tailor-made for your workflow.
Don’t know where to start?
We can help!
Get in touch with one of our technical consultants today.