Table of Contents
Introduction
Recently, Intel launched its new Core™ Ultra 200S Plus processors – the Intel Core™ Ultra 7 270K Plus and the Core™ Ultra 5 250K Plus – to near universal acclaim. Although not able to unseat AMD’s dominance of the top-end gaming segment, they offered class-leading productivity performance at incredibly low prices. Rather than a mid-generation halo product refresh, as we’ve seen in past generations, the 270K Plus and 250K Plus give a breath of fresh air to the product line, effectively relegating any other 200S processors to redundancy.

As we explored in our Content Creation Review article, the Intel Core Ultra 200S product line has been largely successful. However, unlike past generations where Intel was primarily competitive in the gaming segment, they have instead offered solid productivity performance while losing ground to Ryzen in the enthusiast space. 200S processors (codenamed Arrow Lake) feature a hybrid-architecture with high-performance P-cores (based on the Lion Cove microarchitecture) and more-efficient E-cores (based on Skymont). This allows Intel to achieve good single-threaded performance while also affordably adding in large numbers of cores for multi-threaded applications.
We’re going to go ahead and recycle our thoughts on the interesting differences between the original 200S and the new 200S Plus processors from our aforementioned content creation review, so readers familiar with that can go ahead and skip straight to the test setup:
With this refresh, Intel is positioning the new 250K Plus as a direct replacement for the 245K, and the 270K Plus as a replacement for the 265K. The most obvious changes with these models, relative to their progenitors, are that Intel has increased the number of E-cores by four, the E-core max boost by 100 MHz, and maximum memory speeds from 6400 to 7200.
Those are substantial changes, bringing the 270K Plus’ specs on paper up to almost match the top-end 285K – but they aren’t the only ones! Intel has also worked to address memory-latency issues that caused performance regression in gaming with the launch of Arrow Lake-S by increasing the speed of their die-to-die interconnect from 2.1 to 3 GHz. Aside from the additional cores, the other changes could theoretically have been achieved by overclocking the previous models. Since we look exclusively at stock performance, due to our focus on reliability in professional applications, seeing Intel validate and implement these capabilities is great.
While these processors are drop-in replacements for current Arrow Lake CPUs, we expect that few end-users already on Core Ultra would feel the need to upgrade; it is more likely that these will interest users looking to migrate from an older platform. That being said, anyone who does choose to purchase one of these new CPUs as an upgrade should look out for two new pieces of software from Intel. First, their iPPP should simplify driver installation by bundling together a few of their drivers and software packages, such as IPF, DTT, PPM, APO, and their new iBOT. Don’t worry if you don’t know what all of those stand for, as most are set and forget. The exception is the APO and iBOT, the latter of which is new and can optimize certain games to run on these Intel CPUs. We won’t be looking at that in this article, but we are confident many other reviewers will cover it within more gaming-centric content. We do appreciate the one-stop nature of installing nearly all necessary drivers through one package (except iGPU and NPU).
Specifications
| wdt_ID | wdt_created_by | wdt_created_at | wdt_last_edited_by | wdt_last_edited_at | CPU Model | Price | L3 Cache | L2 Cache | P-Cores | E-Cores | Threads | Maximum Boost Clock | E-Core Boost Clock | Default PPT |
|---|---|---|---|---|---|---|---|---|---|---|---|---|---|---|
| 1 | Evan | Mar 2026 01:31 PM | Evan | Mar 2026 01:31 PM | AMD Ryzen 9 9950X3D | 700 | 128 | 16 | 16 | 32 | 5.70 | 200 | ||
| 2 | Evan | Mar 2026 01:31 PM | Evan | Mar 2026 01:31 PM | AMD Ryzen 9 9950X | 550 | 64 | 16 | 16 | 32 | 5.70 | 200 | ||
| 3 | Evan | Mar 2026 01:31 PM | Evan | Mar 2026 01:31 PM | Amd Ryzen 9 9900X3D | 600 | 128 | 12 | 12 | 24 | 5.70 | 162 | ||
| 4 | Evan | Mar 2026 01:31 PM | Evan | Mar 2026 01:31 PM | AMD Ryzen 9 9900X | 440 | 64 | 12 | 12 | 24 | 5.60 | 162 | ||
| 5 | Evan | Mar 2026 01:31 PM | Evan | Mar 2026 01:31 PM | AMD Ryzen 7 9850X3D | 500 | 96 | 8 | 8 | 16 | 5.60 | 162 | ||
| 6 | Evan | Mar 2026 01:31 PM | Evan | Mar 2026 01:31 PM | AMD Ryzen 7 9800X3D | 480 | 96 | 8 | 8 | 16 | 5.20 | 162 | ||
| 7 | Evan | Mar 2026 01:31 PM | Evan | Mar 2026 01:31 PM | AMD Ryzen 7 9700X | 340 | 32 | 8 | 8 | 16 | 5.50 | 88 | ||
| 8 | Evan | Mar 2026 01:31 PM | Evan | Mar 2026 01:31 PM | AMD Ryzen 5 9600X | 220 | 32 | 6 | 6 | 12 | 5.40 | 88 | ||
| 9 | Evan | Mar 2026 01:31 PM | Evan | Mar 2026 01:51 PM | Intel Core Ultra 9 285K | 580 | 36 | 40 | 8 | 16 | 24 | 5.70 | 4.60 | 250 |
| 10 | Evan | Mar 2026 01:31 PM | Evan | Mar 2026 01:50 PM | Intel Core Ultra 7 270K Plus | 300 | 36 | 40 | 8 | 16 | 24 | 5.50 | 4.70 | 250 |
| 11 | Evan | Mar 2026 01:31 PM | Evan | Mar 2026 01:50 PM | Intel Core Ultra 7 265K | 290 | 30 | 36 | 8 | 12 | 20 | 5.50 | 4.60 | 250 |
| 12 | Evan | Mar 2026 01:31 PM | Evan | Mar 2026 01:50 PM | Intel Core Ultra 5 250K Plus | 200 | 30 | 30 | 6 | 12 | 18 | 5.30 | 4.70 | 159 |
| 13 | Evan | Mar 2026 01:31 PM | Evan | Mar 2026 01:49 PM | Intel Core Ultra 5 245K | 200 | 24 | 26 | 6 | 8 | 14 | 5.30 | 4.60 | 159 |
The most exciting part of this launch, from our perspective, is the price. Previously, the 8P+16E core configuration was only available with a Core™ Ultra 9 285K – priced at around $580. That same core layout is now available in the 270K Plus for only $300. Although there are still some minor clock speed differences, Intel is essentially putting the 285K on a fire sale at nearly half off! Similarly, while the 250K Plus isn’t quite a core-for-core match to the 265K, it is very close – and costs $100 less.
Otherwise, the spec differences are largely as we covered above. The 250K Plus offers 4 more E-cores over the 245K, and a higher E-core boost, but is otherwise the same. Similarly, 270K Plus offers 4 more E-cores over the 265K and a higher E-core boost for $10 more (though we suspect street pricing may shift some). The 270K Plus is therefore nearly a 285K, but with a lower P-core max boost and higher E-core max boost.
Comparing to AMD has become increasingly difficult as they have very different CPU designs, but based on cost, the 270K Plus is positioned to undercut the Ryzen™ 7 9700X by about $40, depending on the current sale/street price. From Intel’s new offering, users will get the same number of P cores as well as “bonus” E cores, with the P-cores having a similar boost. The 270K Plus also offers more L3 Cache – and far more L2 cache – though it also draws a lot more power. On paper, that is a favorable comparison for Intel. The 250K Plus is positioned about $20 below the 9600X and again offers the same number of performance cores while also including E-cores and more cache overall, again with a much higher power budget.
Test Setup (Expandable)
AMD Ryzen Test Platform
| CPUs: AMD Ryzen™ 9 9950X3D AMD Ryzen™ 9 9900X3D AMD Ryzen™ 7 9850X3D AMD Ryzen™ 7 9700X |
| CPU Cooler: Noctua NH-U12A |
| Motherboard: ASUS ProArt X670E-Creator WiFi BIOS Version: 3513 |
| RAM: 2x DDR5-5600 32GB (64 GB total) |
| GPU: NVIDIA RTX PRO™ 5000 Blackwell Driver Version: 595.71 |
| PSU: EVGA SuperNOVA 850W P2 |
| Storage: Samsung 980 Pro 2TB |
| OS: Windows 11 Pro 64-bit (26200) Power Profile: Balanced |
Intel Core Ultra Test Platform
| CPUs: Intel Core™ Ultra 7 270K Plus Intel Core™ Ultra 5 250K Plus Intel Core™ Ultra 9 285K Intel Core™ Ultra 7 265K Intel Core™ Ultra 5 245K |
| CPU Cooler: Noctua NH-U12A |
| Motherboard: ASUS ProArt Z890-Creator WiFi BIOS version: 3002 |
| RAM: 2x Kingston FURY Renegade 24GB (48 GB total) Core Ultra: JEDEC 6400 “B” Spec Core Ultra Plus: JEDEC 7200 “B” Spec |
| GPU: NVIDIA RTX PRO™ 5000 Blackwell Driver Version: 595.71 |
| PSU: EVGA SuperNOVA 1200W P2 |
| Storage: Samsung 980 Pro 2TB |
| OS: Windows 11 Pro 64-bit (26200) Power Profile: Balanced |
Benchmark Software
| Autodesk Inventor 29.4 — InvMark 2025.0.15 |
| Autodesk Revit 25.3 — RFO Benchmark 3.4 |
| SOLIDWORKS 2024 5.0— SPECapc for SOLIDWORKS 2024.1.13 |
| PIX4Dmatic 1.81.1 — 100 image dataset (methodology) |
We followed our standard methodology for this review, with Intel and AMD-based platforms featuring ASUS ProArt motherboards and NVIDIA RTX PRO™ 5000 Blackwell GPUs. Windows, BIOSes, and drivers were all up to date as of the start of the testing. In line with our focus on professional workflows, we kept the processors running stock: overclocking features such as ASUS MCE and MLB were disabled, as was AMD’s PBO, and the Intel processors were run with the default “Performance” power plan. RAM was locked to the maximum CPU-supported frequency at JEDEC timings: 5600 for AMD and 6400 or 7200 for Intel, depending on the model. Additionally, we left Windows security settings like VBS in their default (enabled) state.
Intel APO was technically enabled, but we did not test any applications that should have performance improvements from it; iBOT was not.
For this review, we tested with our standard set of engineering benchmarks: InvMark for Inventor, RFO Benchmark for Revit, SPECapc for Solidworks, and our in-house PIX4Dmatic benchmark.
Inventor
The first engineering application we tested was Autodesk Inventor, a popular CAD application. We are continuing to track an issue with Autodesk Inventor and InvMark where drawing scores are both low and inconsistent on Windows 11. Due to this, we do not have an InvMark (overall) or multi-core score. However, we have computed a proxy: adjusted average score, which combines the unaffected categories to give a rough idea of overall performance.
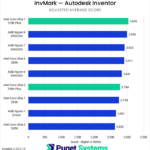
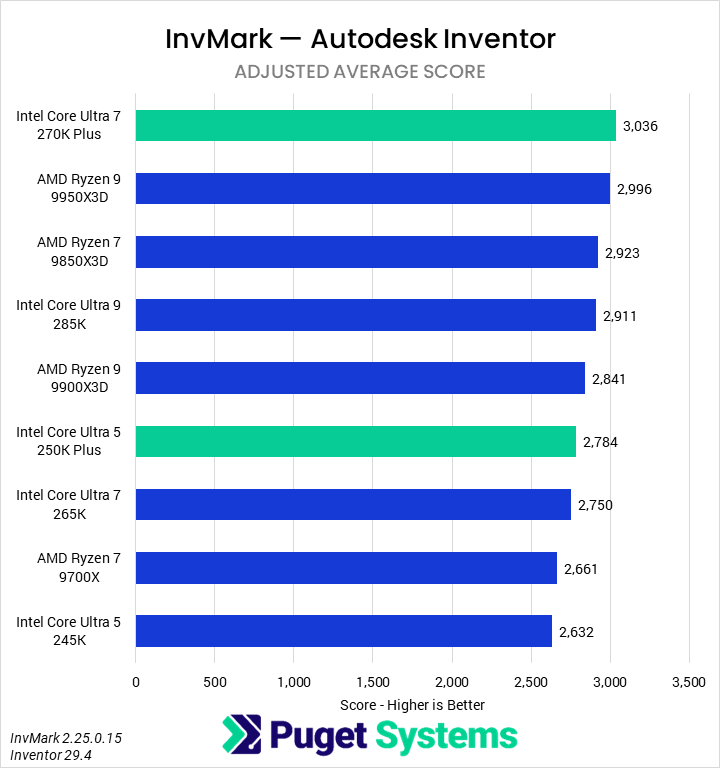
The first score we looked at in our analysis was the aforementioned adjusted average (Chart #1). It is computed from several subscores – some not shown in their own charts – but with the aberrant multi-core score and the separately-presented single-core score left out. We found that the Core Ultra 7 270K Plus was the fastest CPU tested, pulling ahead of the 9950X3D, 9850X3D, and 285K by a slim margin. It was 10% faster than the 265K and 14% faster than the 9700X. On the lower end, the 250K Plus was 6% faster than the 245K.
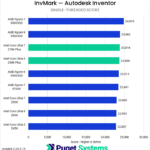
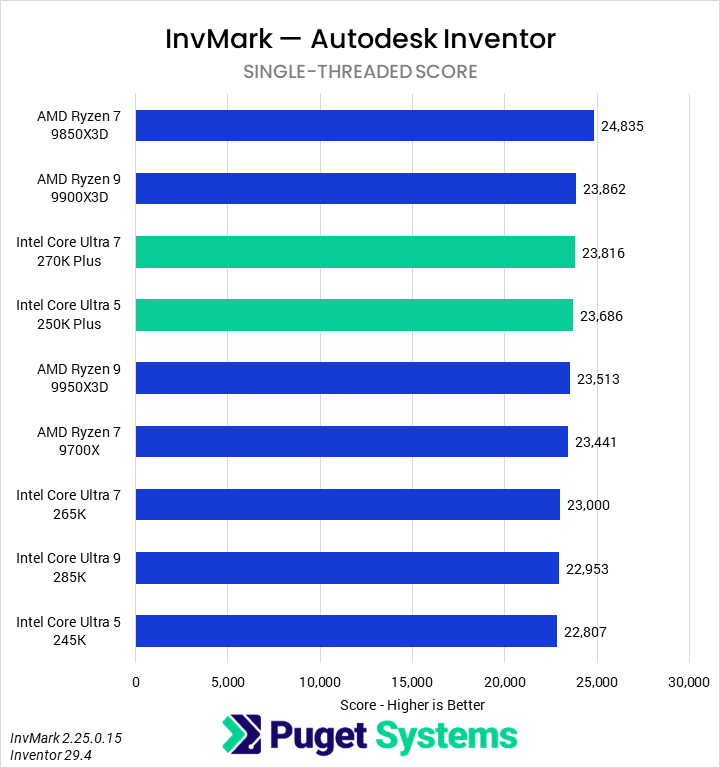
The single-threaded score (Chart #2) is a composite score native to the benchmark and derived from multiple subscores. We believe it to be slightly academic as an indicator of application performance compared to the specific sub-scores. AMD leads this category, with the 9850X3D topping the chart, followed by the 9900X3D. However, the new Intel processors did manage to take the next two spots, representing a notable, if small, performance improvement, likely from the changes to the memory system and die-to-die interconnect. Both the 270K Plus and 250K Plus were about 4% faster than the 265K and 245K, respectively, while the 270K Plus was 2% faster than the 9700X.
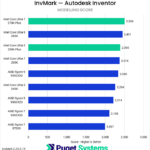
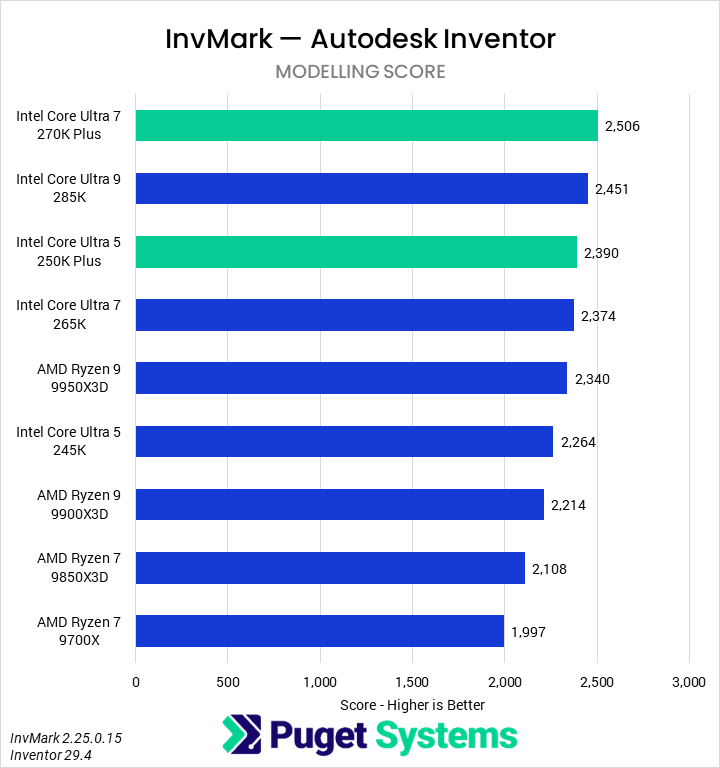
In CAD applications, the modeling tests (Chart #3) are often the most important in representing the everyday user experience. Intel’s new 270K Plus topped this chart, outperforming the 285K by 2%, the 265K by 6%, and the 9700X by 25%. AMD’s fastest CPU, the 9950X3D, was 7% slower, beating only the 245K from Intel. Speaking of the 245K, the 250K beat it by 6%.
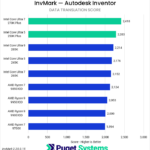
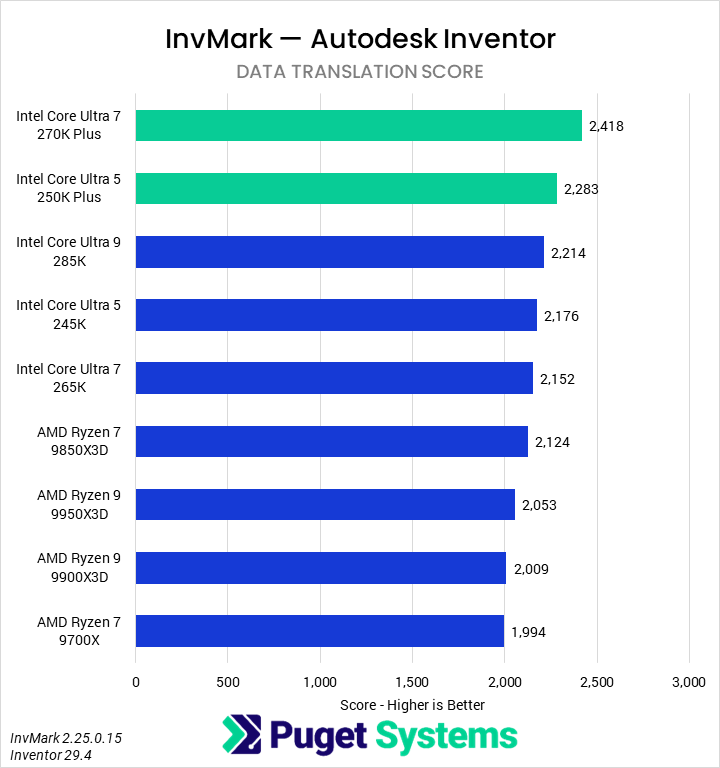
The Data Translation test (Chart #4) converts a STEP file into a native Inventor file. Our past testing showed this task slightly favoring Intel, and with the new Core Ultra Plus processors, this lead is solidified. The 270K Plus was 12% faster than the 265K and 21% faster than the 9700X. The 250K Plus came in just behind it, leading the 245K by 5% and, impressively, outperforming even the 285K by 3%.
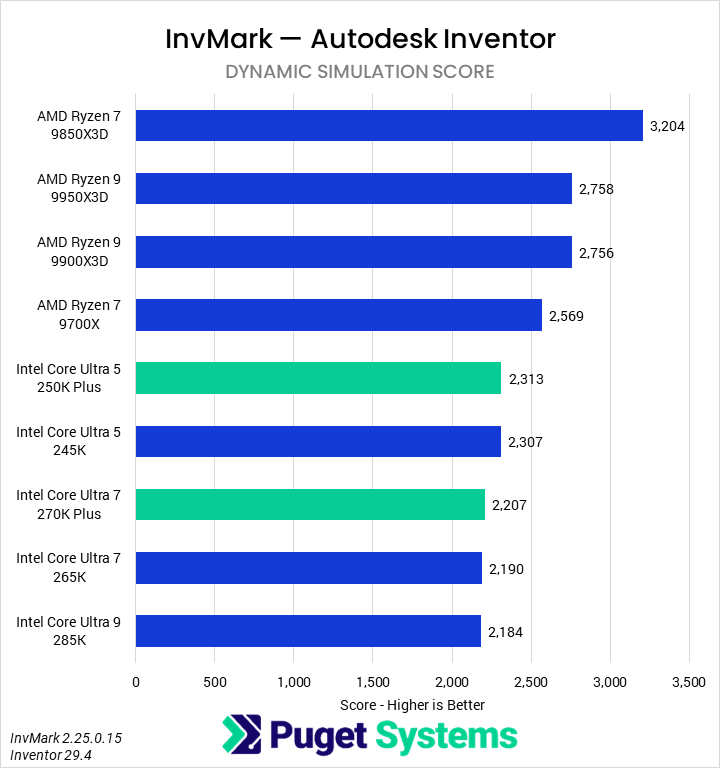
We have previously found Dynamic Simulation (Chart #5) to favor AMD. Interestingly, in this round of testing, the 9850X3D was not only the fastest CPU, but by a sizable margin – despite previously finding that this tended to scale with cores on AMD processors. Intel’s 270K Plus was technically ahead of the 265K, but by a small enough margin to be irrelevant; ditto with the 250K Plus and 245K. This means that the 270K Plus was still slower than the 9700X, and by a substantial 14% margin.
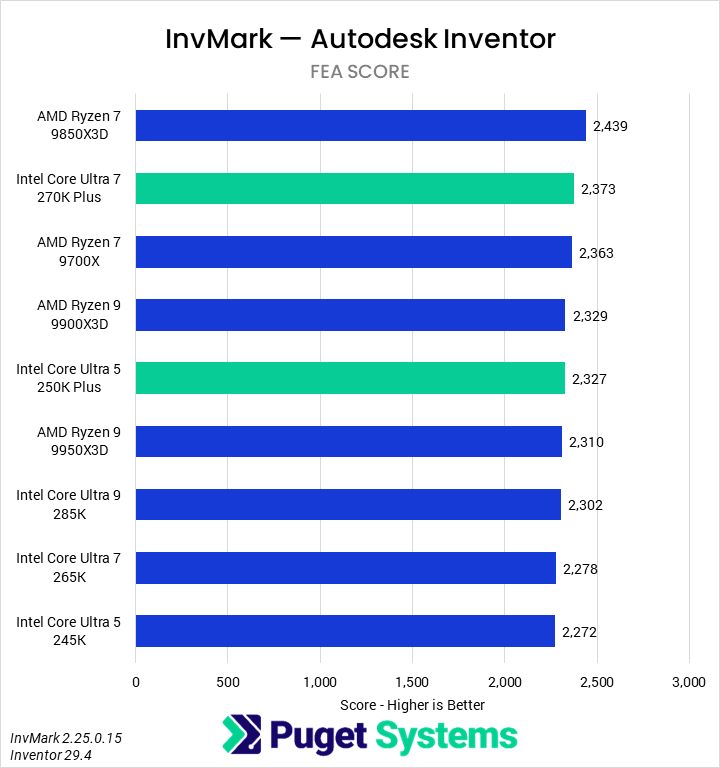
Finally, FEA (Chart #6) shows weak scaling with CPUs overall. The 270K Plus performed well, second only to the 9850X3D, but given that the difference between it and the slowest CPU – the 245K – was only 4%, we are confident saying that any modern processor is sufficient, or at least equivalent, for FEA in Inventor.
Overall, we think that the 270K Plus is the best processor for Autodesk Inventor. It not only leads in the blended score but is also the fastest processor in one of the most important areas: modeling. For some workflows AMD has better offerings, and we suspect it may also lead in drawing, but we continue to express caution around definitively crowning a “best CPU for Inventor” until the issues with the InvMark drawing tests are resolved.
Revit
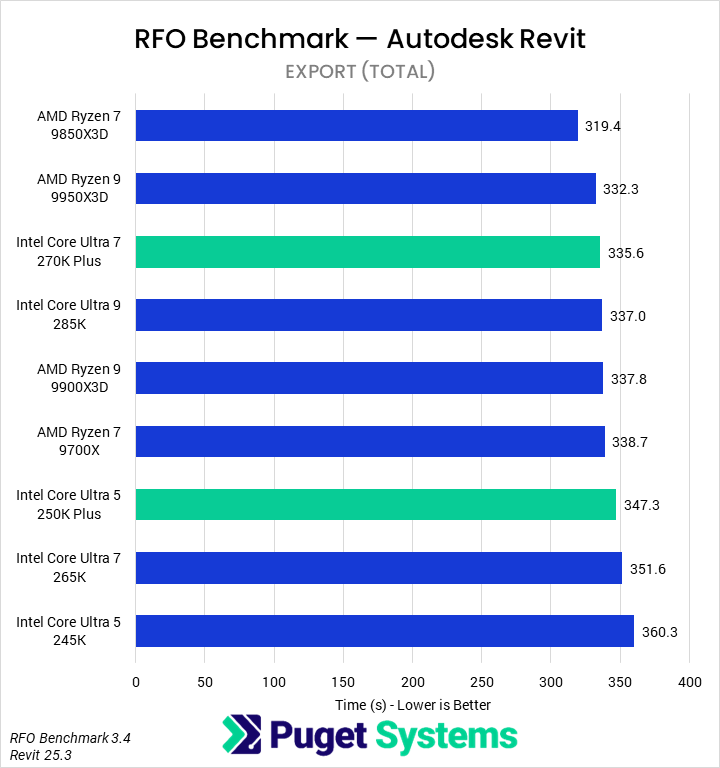
Revit, a BIM application also from Autodesk, was the next software title we tested. We use the RFO Benchmark’s “Full_Standard” preset at 4K resolution. This benchmark, by default, calculates two top-level scores: Model Creation time and Graphics time. We supplement this by also calculating a total export time. One area we did not look at for this review was rendering time.
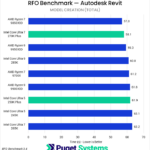
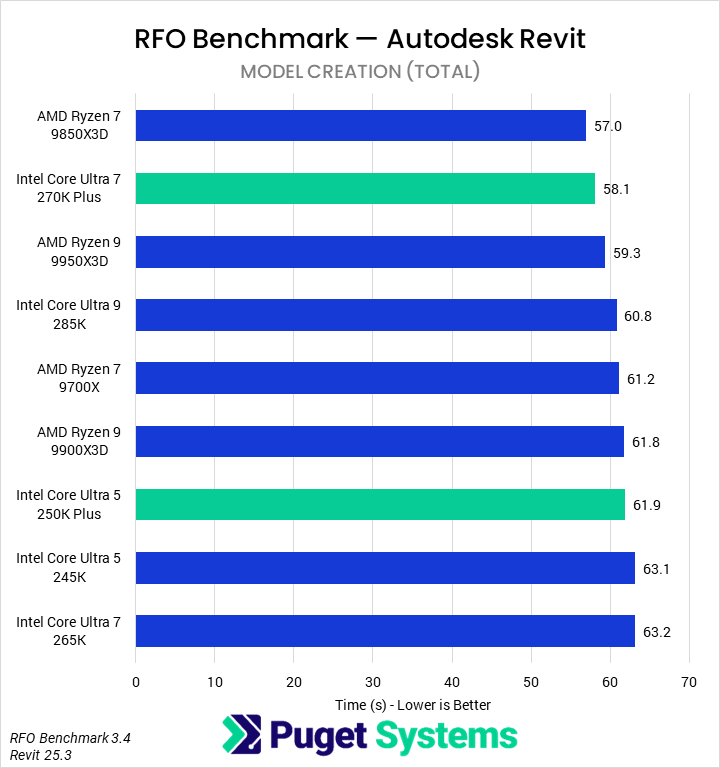
In the Model Creation tests (Chart #1), we found that AMD’s 9850X3D completed the work in the lowest time, just ahead of the 270K Plus. The 270K Plus in turn was 8% faster than the 265K (which performed fairly poorly), 4% faster than the 285K, and 5% faster than the 9700X. Intel’s 250K Plus showed improvements over the 245K, but they were minor at only about 2%. Frankly, many of the results were within the margin of error of our testing, but it certainly seems like Intel’s new processors offer competent performance.
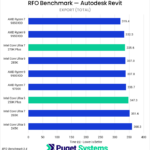
Exporting (Chart #2) showed similar trends. The 270K Plus was slower than the 9850X3D by 5% and the 9950X3D by 1%, while leading the 285K and 9700X by 1%, and the 265K by 5%. The 250K Plus was marginally ahead of the 245K. AMD, overall, tends to be faster for this task – but the results are similar enough to be irrelevant for most users.
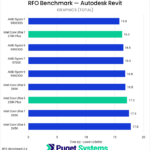
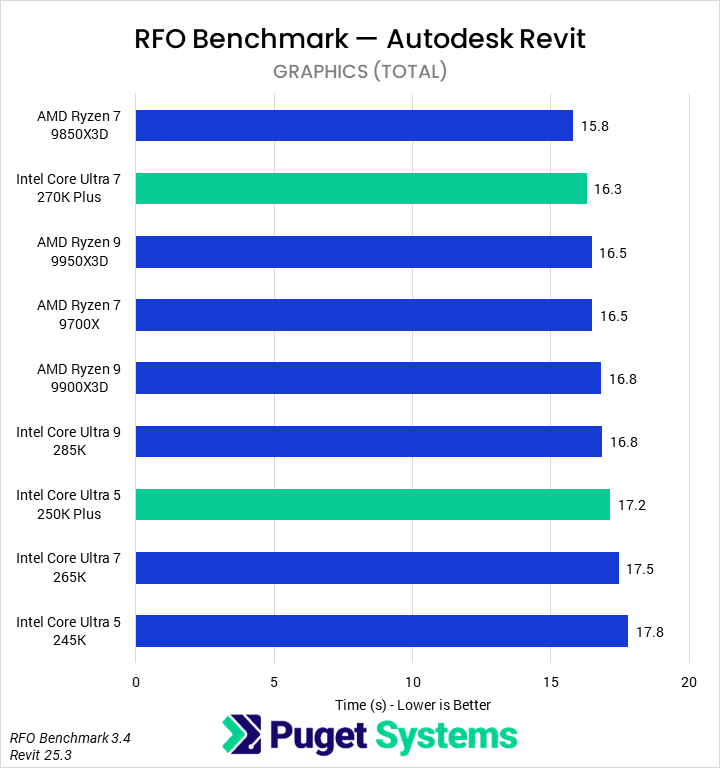
Interestingly, we saw more scaling in the Graphics tests (Chart #3). The 270K Plus was slower than the 9850X3D by about 3%, but did match the 9700X and improve on the 265K by 7%. The new 250K Plus was less impressive, only beating the 245K by 3%.
Although the Core Ultra 200S Plus processors close the gap somewhat in Revit, we would still generally recommend a midrange Ryzen X3D processor from AMD for this application, whether that is the 9850X3D we tested today or the 9800X3D we have looked at in the past. Intel’s 200S chips do offer solid performance for their price, and are never too much slower, so the 270K Plus or 250K Plus may make sense for a more budget system.
SOLIDWORKS
SOLIDWORKS, by Dassault Systèmes, is a very popular CAD software package. For our SPECapc for SOLIDWORKS testing, we recorded all of the CPU-specific subscores, although we will not be examining all of them in detail in these charts. As is typical, we ran the benchmark at 4K resolution with 150% screen scaling and FSAA enabled. Because of this, our numbers are not comparable to submissions readers may see elsewhere, but they are consistent across our articles.
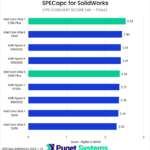
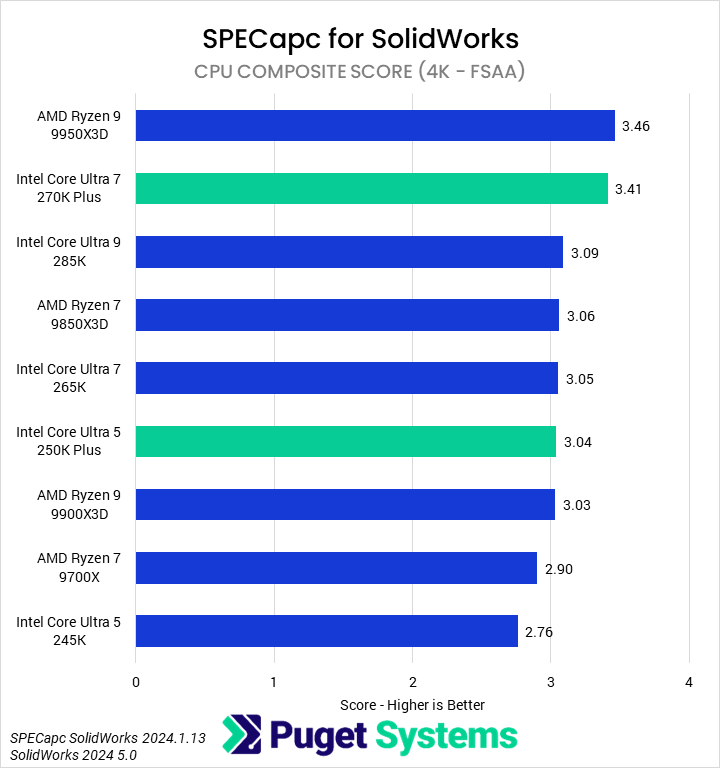
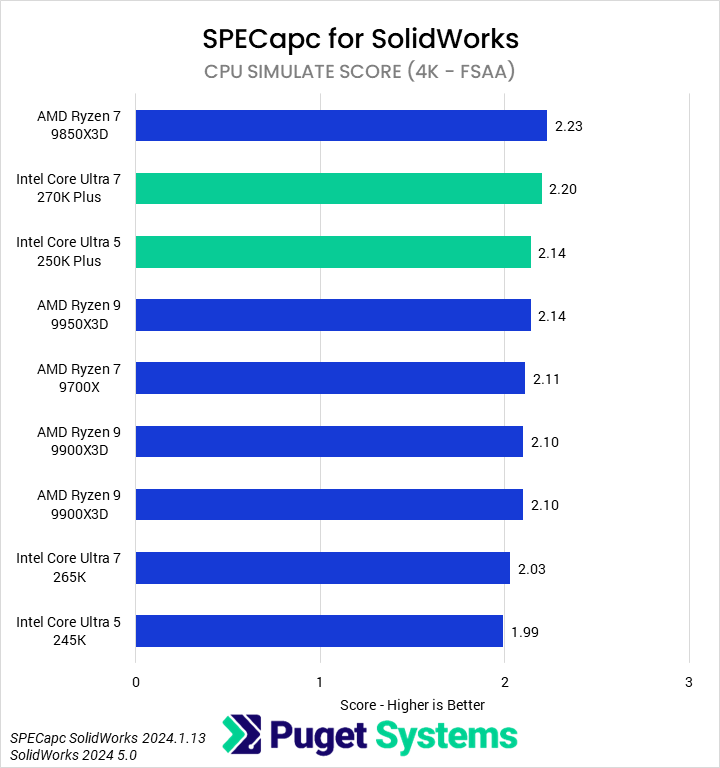
Starting with the CPU Composite score (Chart #1), our results showed that the 270K Plus was the second fastest CPU overall, only a mere 1% behind the 9950X3D. It showed strong performance improvements over the 285K (10%), 265K (12%), and 9700X (18%). The 250K Plus was also highly performant, nearly matching the 265K and with a 10% uplift over the 245K. This is a great result for Intel.
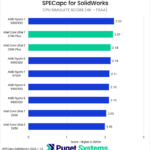
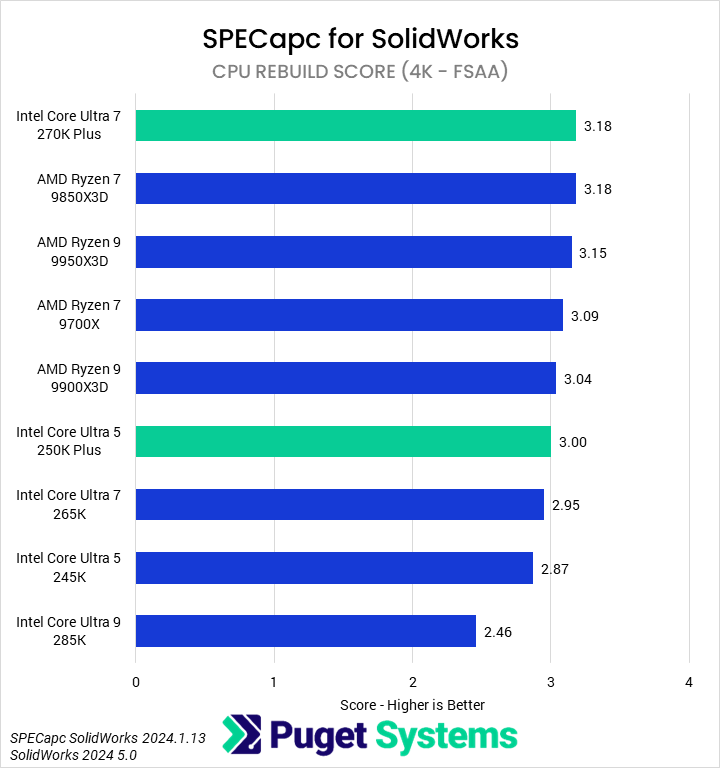
In many ways, the Rebuild score (Chart #2) is the most relevant for many users of SolidWorks. Impressively, given AMD’s past lead in this area, the 270K Plus tied the 9850X3D in these tests, giving it a minor lead over the 9950X3D and a 3% advantage over the 9700X. Though a smaller improvement, the 250K also beats the 245K by 5%. Interestingly, our 285K continues to perform poorly in this portion of SOLIDWORKS, although we did observe significant inconsistency in results across multiple runs for these tests.
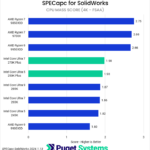
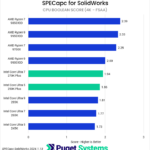
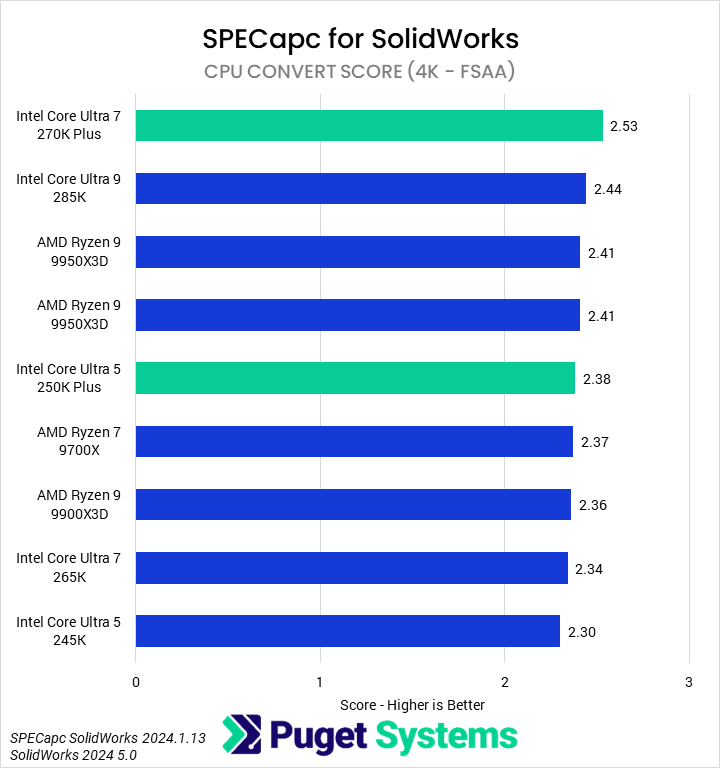
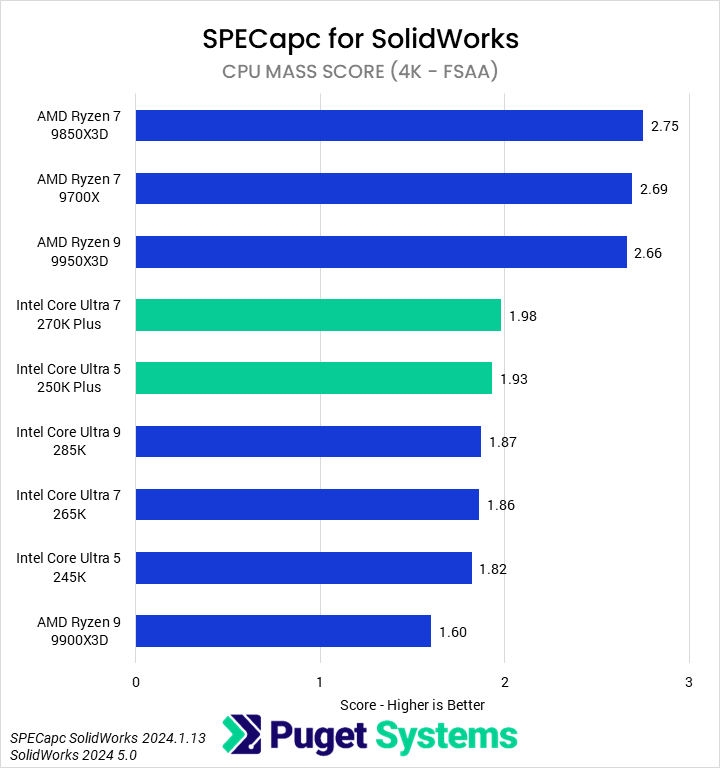
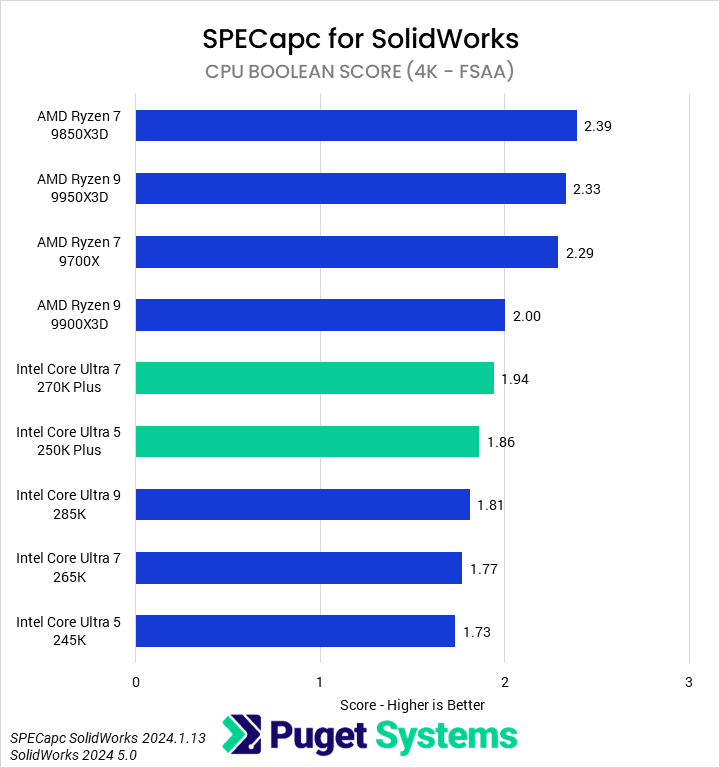
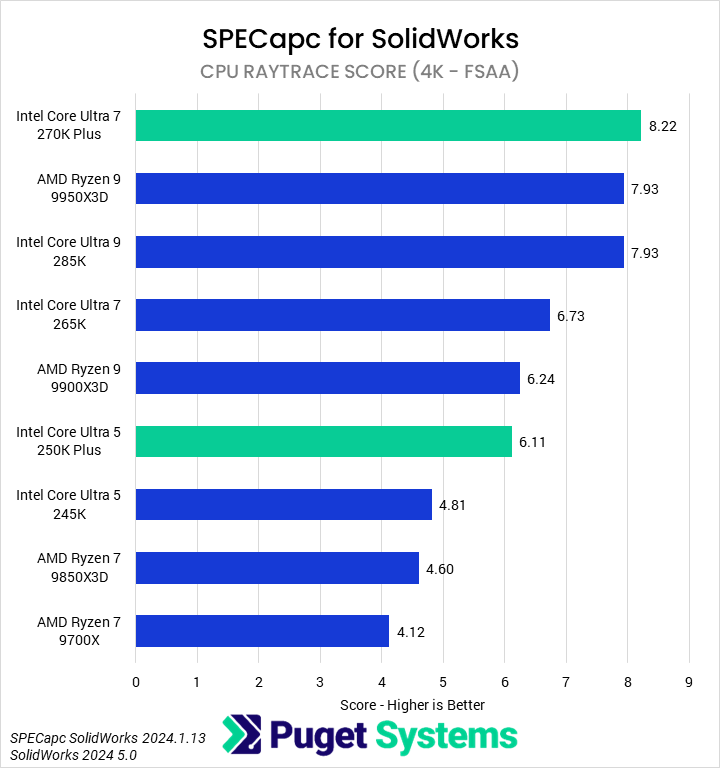
We will only briefly touch on the remaining scores. CPU Convert (Chart #3) and Raytrace (Chart #7) showed the 270K Plus to be the fastest CPU, with it performing particularly well in the Raytrace test. CPU Mass (Chart #5) and Boolean (Chart #6) tests heavily favor AMD, with essentially all of its processors outperforming any Intel model.
Overall, we think that the new 270K Plus offers the best blend of price and performance for most SOLIDWORKS users, particularly due to its strength in the Rebuild tests. However, those with more exotic workflows may find that an AMD processor offers better results in some areas.
PIX4Dmatic
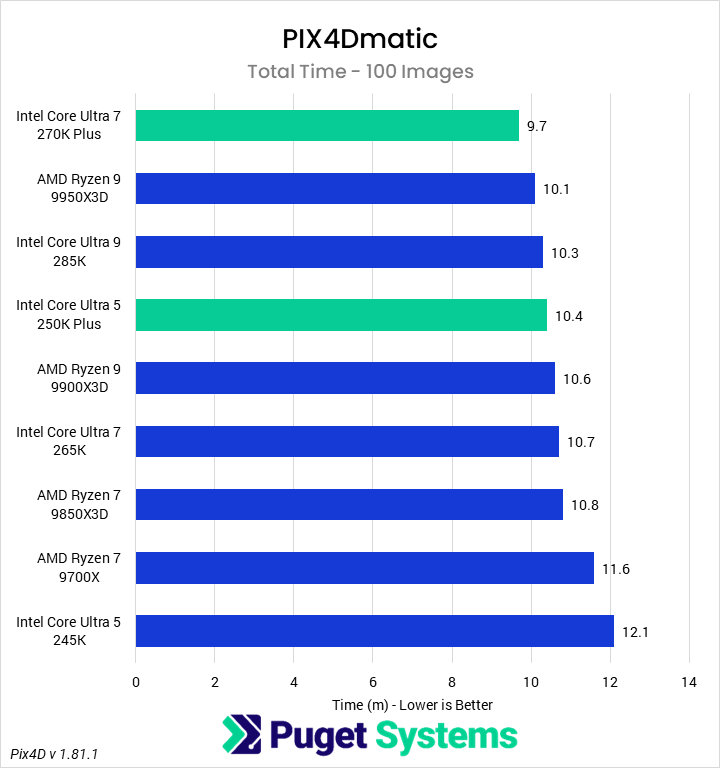
The final application we tested with was industry-leading photogrammetry software PIX4Dmatic. For this set of testing, we used our in-house benchmark with the small dataset. In the past, we have found this small dataset exhibits similar CPU scaling to larger projects. Although we collect information on various subphases of the photogrammetry process and outputs, we have collated all of this into a singular total time. This represents importing and calibrating images; generating dense point clouds, textured meshes, and DSM; and then exporting the project. Although not all these individual steps scale the same, we did not find much additional interesting information in separating them out for this review.
Image
Overall, we found that the 270K Plus completed our 100-image benchmark faster than any other CPU in this roundup. It finished the process 4% faster than the 9950X3D, 6% faster than the 285K, 9% faster than the 265K, and 17% faster than the 9700X. In many ways, though, the 250K Plus is even more impressive, finishing the test 16% faster than the 245K and nearly matching the 285K. However, based on past tests with larger data sets, for multi-thousand-image projects, a 9950X3D or 32-core Threadripper will still likely give better performance overall – though at a much higher price.
Conclusion
Intel’s new Core Ultra 200S Plus processors – the 270K Plus and 250K Plus – are very impressive in engineering workloads. Although less of a landslide win over AMD than in professional content creation workflows, they offer some of the best performance across most of the applications we tested, and certainly the best price-to-performance ratio.
In CAD applications like SOLIDWORKS and Inventor, the 270K Plus was the fastest processor for modeling and (re)building, even where, in past testing, we found AMD to be faster. It wasn’t always the best CPU, as some tasks like Dynamic Simulation in Inventor and Booleans in SOLIDWORKS still heavily favor AMD, so while we would generally recommend it for these, we encourage users to examine their own pain points in their workflows. The 250K Plus, though slower, also showed impressive gains over the 245K and often outperformed even the 265K.
Although both the 270K Plus and 250K Plus performed well in Revit, they still were not able to overtake AMD’s Ryzen 7 9850X3D. The performance difference, especially between the 9850X3D and 270K Plus, is small enough that price-conscious users may prefer the 270K Plus, but the fastest results do still come from AMD. In contrast, Intel did manage to overtake AMD in PIX4Dmatic. We found that the 270K Plus was 4% faster than the 995X3D in our 100-image set, while the 250K Plus nearly matched the 285K, outclassing the 9900X3D. However, we also expect that those with large datasets (thousands of images) may get better overall performance from a 9950X3D or higher core count Threadripper.
The Intel Core Ultra 7 270K Plus and Core Ultra 5 250K Plus are both highly performant CPUs that offer both improvements over the current 200S product line and an overall reduction in price for that performance. Although they aren’t the best for every engineering workflow, we continue to be impressed by the newest addition to Intel’s product line.
If you need a powerful computer to tackle the applications we’ve tested, the Puget Systems workstations on our solutions page are tailored to excel in various software packages. If you prefer a more hands-on approach, our custom configuration page helps you configure a system that matches your specific needs. Or, if you would like guidance to select hardware for your unique workflow, our knowledgeable technology consultants are here to lend their expertise.
Looking for a new desktop workstation?
We build computers tailor-made for your workflow.
Don’t know where to start?
We can help!
Get in touch with one of our technical consultants today.