Skip to content
Main Navigation Puget Systems Logo in White and Green
  • Solutions
    • Media & Entertainment
      • Photo Editing
        • Recommended Systems For:
        • Adobe Lightroom Classic
        • Adobe Photoshop
        • Generative AI
      • Video Editing & Motion Graphics
        • Recommended Systems For:
        • Adobe After Effects
        • Adobe Premiere Pro
        • DaVinci Resolve
        • Foundry Nuke
      • 3D Design & Animation
        • Recommended Systems For:
        • Autodesk 3ds Max
        • Autodesk Maya
        • Blender
        • Cinema 4D
        • Houdini
        • ZBrush
      • Live Video Production
        • Recommended Systems For:
        • vMix
        • Live Streaming
      • Real-Time Engines
        • Recommended Systems For:
        • Game Development
        • Unity
        • Unreal Engine
        • Virtual Production
      • Rendering
        • Recommended Systems For:
        • Keyshot
        • OctaneRender
        • Redshift
        • V-Ray
      • Digital Audio
        • Recommended Systems For:
        • Ableton Live
        • FL Studio
        • Pro Tools
    • Engineering
      • Architecture & CAD
        • Recommended Systems For:
        • Autodesk AutoCAD
        • Autodesk Inventor
        • Autodesk Revit
        • SOLIDWORKS
      • Visualization
        • Recommended Systems For:
        • Enscape
        • Keyshot
        • Lumion
        • Twinmotion
      • Photogrammetry & GIS
        • Recommended Systems For:
        • ArcGIS Pro
        • Agisoft Metashape
        • PIX4D
        • RealityScan
    • AI & HPC
      • AI Development & Deployment
        • Recommended Systems For:
        • AI Development
        • AI Deployment & Inference
        • Servers for Scaling AI & LLMs
      • High Performance Computing
        • Recommended Systems For:
        • Data Science
        • Scientific Computing
    • More
      • Recommended Systems For:
      • Compact Size
      • NVIDIA RTX Studio
      • Virtual Reality
    • Business & Enterprise
      We can empower your company
    • Government & Education
      Services tailored for your organization
  • Products
    • Puget Mobile
      Powerful laptop workstations
      • Puget Mobile 16″
    • Puget Workstations
      High-performance Desktop PCs
      • AMD Ryzen
        Powerful CPUs with up to 16 cores
      • AMD Threadripper
        High core counts and lots of PCIe lanes
      • AMD EPYC
        Server-class CPUs in a workstation
      • Intel Core Ultra
        Balanced single- and multi-core performance
      • Intel Xeon
        Workstation CPUs with AVX512
      • NVIDIA
        NVIDIA DGX Spark and DGX Station
      • Configure a Custom PC Workstation
        Configure a PC for your workflow
    • Puget Rackstations
      Workstations in rackmount chassis
      • AMD
        Ryzen, Threadripper, and EPYC CPUs
      • Intel
        Core Ultra and Xeon Processors
      • Configure a Custom Rackmount Workstation
        Tailored 4U, 5U, and 6U rack systems
    • Puget Servers
      Enterprise-class rackmount servers
      • 1U Rackmount
        Dense CPU compute servers
      • 2U Rackmount
        Mixed CPU and GPU solutions
      • 4U Rackmount
        High-density GPU computing
      • Multi-Node Servers
        2-4 servers in a single chassis
      • Liquid-Cooled GPU Servers
        Powered by Comino
      • Custom Servers
        Engineered to meet your unique needs
    • Puget Storage
      Solutions from desktop to datacenter
      • Network-Attached Storage
        Synology desktop and rackmount NAS
      • Software-Defined Storage
        Datacenter solutions with QuantaStor
    • Recommended Third Party Peripherals
      Curated list of accessories for your workstation
    • Puget Bench for Creators
      Professional benchmarking tools
  • Publications
    • Articles
    • Blog Posts
    • Case Studies
    • HPC Blog
    • Podcasts
    • Press
  • Support
    • Contact Support
    • Onsite Services
    • Support Articles
    • Unboxing
    • Warranty Details
  • About Us
    • About Us
    • Careers
    • Contact Us
    • Enterprise
    • Gov & Edu
    • Our Customers
    • Press Kit
    • Puget Gear
    • Testimonials
  • Talk to an Expert
  • My Account
  1. Home
  2. /
  3. Hardware Articles
  4. /
  5. Intel Xeon 600 Workstation Content Creation Review

Intel Xeon 600 Workstation Content Creation Review

Posted on November 9, 2026 (November 6, 2026) by Evan Lagergren | Last updated: November 6, 2026
LinkedIn

Table of Contents

  • Introduction
  • Specifications
  • Test Setup
  • Graphic Design: Adobe Photoshop
  • Video Editing: Adobe Premiere
  • Motion Graphics: Adobe After Effects
  • Video Editing/Motion Graphics: DaVinci Resolve Studio
  • Game Dev/Coding: Unreal Engine & Visual Studio
  • CPU Rendering: Cinebench, V-Ray, Blender, KeyShot, & Corona
  • HPC: Linpack
  • Conclusion

Introduction

In February 2026, Intel announced the launch of its Xeon® 600 Processors for Workstation. These processors, nominally competing in the same market segment as AMD’s incredibly popular Threadripper™ and Threadripper™ PRO models, have been hard to come by for individuals, reviewers, and system integrators alike; an apparent product shortage has plagued them since launch. However, we have now had hands-on time with enough of the product family to write an — admittedly belated — review.
Xeon 600 Workstation performance article featured image with text reading "Does Xeon 600 bring competition back to workstation?"

Intel’s Xeon 600 processors are a continuation of the Xeon 6 family, which saw its first release in early 2025. The Xeon 6 family includes both the high-performance P-core Granite Rapids and high-efficiency E-core Sierra Forest variants, and these Xeon 600 workstation chips belong to the Granite Rapids branch of the family tree. Although we haven’t looked much at Xeon 6, we did publish an article in late 2025 comparing the two variants of server CPUs in rendering.

Xeon 600 for Workstation (or WS — but we’ll usually just refer to it as Xeon 600 from here on out) uses the LGA4710 socket, similar to many other Xeon 6 parts. However, it only supports the W890 Chipset, as seen on motherboards such as the ASUS Pro WS W890-SAGE SE, which we used for all of our testing. Like the rest of the Granite Rapids family, these CPUs are built around Intel’s Redwood Cove P-cores, as seen in its 14th-gen Mobile processors (Meteor Lake).

Intel claims that Xeon 600 offers up to 61% better multi-threaded performance compared to the previous-gen W-3500 series processors, 10% better single-threaded performance, more cache, higher memory frequency support (6400 Mbps vs 4800 Mbps), and, at the top end, more cores. Additionally, the new processors bring with them support for Intel AMX (Advanced Matrix Extensions), optimized for AI and machine learning workloads.

Specifications

wdt_ID wdt_created_by wdt_created_at wdt_last_edited_by wdt_last_edited_at Manufacturer Class CPU Model MSRP Cores L2 Cache L3 Cache Boost Clock Base Clock Memory Speed PCIe Lanes Max Power/PPT Release Date
1 Evan Oct 2026 01:35 PM Evan Oct 2026 01:35 PM AMD Workstation AMD Ryzen Threadripper PRO 9995WX 13,000 96 96 384.0 5.40 2.50 6,400 128 350 Jul 2025
2 Evan Oct 2026 01:35 PM Evan Oct 2026 01:35 PM AMD Workstation AMD Ryzen Threadripper PRO 9985WX 8,500 64 64 256.0 5.40 3.20 6,400 128 350 Jul 2025
3 Evan Oct 2026 01:35 PM Evan Oct 2026 01:35 PM AMD Workstation AMD Ryzen Threadripper PRO 9975WX 4,400 32 32 128.0 5.40 4.00 6,400 128 350 Jul 2025
4 Evan Oct 2026 01:35 PM Evan Oct 2026 01:35 PM AMD Workstation AMD Ryzen Threadripper PRO 9965WX 3,100 24 24 128.0 5.40 4.20 6,400 128 350 Jul 2025
5 Evan Oct 2026 01:35 PM Evan Oct 2026 01:35 PM AMD Workstation AMD Ryzen Threadripper PRO 9955WX 1,700 16 16 64.0 5.40 4.50 6,400 128 350 Jul 2025
6 Evan Oct 2026 01:35 PM Evan Oct 2026 01:35 PM Intel Workstation Intel Xeon 698X 8,500 86 196 336.0 4.80 2.00 6,400 128 420 Feb 2026
7 Evan Oct 2026 01:35 PM Evan Oct 2026 01:35 PM Intel Workstation Intel Xeon 696X 6,100 64 128 336.0 4.80 2.40 6,400 128 420 Feb 2026
8 Evan Oct 2026 01:35 PM Evan Oct 2026 01:35 PM Intel Workstation Intel Xeon 678X 4,100 48 96 192.0 4.90 2.40 6,400 128 360 Feb 2026
9 Evan Oct 2026 01:35 PM Evan Oct 2026 01:35 PM Intel Workstation Intel Xeon 676X 2,800 32 64 144.0 4.90 2.80 6,400 128 330 Feb 2026
10 Evan Oct 2026 01:35 PM Evan Oct 2026 01:35 PM Intel Workstation Intel Xeon 658X 1,900 24 48 144.0 4.90 3.00 6,400 128 300 Feb 2026
Manufacturer Class

The first thing of note for the new Xeon 600 processors, as compared to the last-gen Xeon W-3500s, is the core count. Xeon 600 supports up to 86 cores with the 698X, 24 more than the top-end 3595X (though still 10 fewer than the AMD Threadripper PRO 9995WX). It also has more “normal” core counts: 64 instead of 60, 48 instead of 44, and 24 instead of 20. Although it shouldn’t make a difference, we have found that Windows and applications often encounter fewer scheduling issues with those core counts, and they better align with competing chips from AMD.

Compared to the prior gen, the frequency of those cores tends to be about the same or slightly lower, although they are achieving that at a lower maximum power draw and TDP. Comparing frequencies across manufacturers isn’t the most meaningful, but Intel does tend to be a good bit (about 500 MHz) slower than AMD’s Threadrippers.

One large improvement this generation is cache, where Intel maintained the 2 MB of L2 Cache per core (compared to 1 MB for AMD) but dramatically increased the amount of L3 Cache from roughly 2 MB per core to about 5 MB per core. This should help performance in cache-sensitive workflows. Continuing the theme of improved data access, Intel also increased the maximum supported memory frequency from 4800 Mbps to 6400 Mbps, matching AMD and most desktop processors, and representing a 33% increase in maximum bandwidth. Alongside this, the number of available PCIe lanes improved slightly, from 112 to 128.

Intel also lowered the price per core for these processors, with the top-end 86-core part, the 698X, coming in at the same price as AMD’s 64-core 9985WX and well below the 96-core 9995WX. The 64-core 696X has an MSRP of $6,100, nearly matching the 60-core 3595X and $2,400 less than AMD’s 9985WX. Across the board, Intel tends to beat out the last-gen parts in cores per dollar and come in under AMD.

Test Setup

Intel Xeon 600 Workstation Test Platform

CPUs:
Intel Xeon 698X
Intel Xeon 696X
Intel Xeon 678X
Intel Xeon 676X
Intel Xeon 658X
CPU Cooler: Noctua NH-U14S DX-4677
Motherboard: ASUS Pro WS W890E-SAGE SE
BIOS version: 0603
RAM: 8x Kingston DDR5-6400 ECC Reg. 16GB (128 GB total)
GPU: NVIDIA GeForce RTX™ 5080
Driver Version: 616.56
PSU: Super Flower LEADEX Titanium 1700W
Storage: Kingston KC3000 2TB
OS: Windows 11 Pro 64-bit (26200)

AMD Threadripper PRO Test Platform

CPUs:
AMD Ryzen Threadripper PRO 9995WX
AMD Ryzen Threadripper PRO 9985WX
AMD Ryzen Threadripper PRO 9975WX
CPU Cooler: Asetek 836S-M1A 360mm
Motherboard: ASUS Pro WS WRX90E-SAGE SE
BIOS Version: 1317
RAM: 8x Kingston DDR5-6400 ECC Reg. 16GB (128 GB total)
GPU: NVIDIA GeForce RTX™ 5080
Driver Version: 616.56
PSU: EVGA SuperNOVA 1600W P2
Storage: Kingston KC3000 2TB
OS: Windows 11 Pro 64-bit (26200)

Intel Xeon W-3500 Test Platform

CPUs:
Intel Xeon w9-3595X
Intel Xeon w9-3575X
Intel Xeon w7-3565X
Intel Xeon w5-3535X
CPU Cooler: Noctua NH-U14S DX-4677
Motherboard: ASUS Pro WS W790E-SAGE SE
BIOS version: 2003
RAM: 8x DDR5-4800 16GB (128 GB total)
GPU: NVIDIA GeForce RTX™ 5080
Driver Version: 616.56
PSU: Super Flower LEADEX Platinum 1600W
Storage: Kingston KC3000 2TB
OS: Windows 11 Pro 64-bit (26200)

Benchmark Software

Photoshop 27.10 — Puget Bench for Photoshop 1.0.6
Premiere 26.3 — Puget Bench for Premiere Pro 2.0.8
After Effects 26.3 — Puget Bench for After Effects 1.1.0
DaVinci Resolve 21.0 — Puget Bench for DaVinci Resolve 2.1.0
Unreal Engine 5.7
Visual Studio 2022
Cinebench 2026
V-Ray 6.00.01
Blender 5.0
KeyShot Benchmark 14.1.1.5
Corona Benchmark 10.0.0.20034
Linpack 2024

We followed our standard methodology for this review, with Intel and AMD-based platforms featuring ASUS Pro WS SAGE motherboards and NVIDIA GeForce RTX™ 5080 GPUs. Windows, BIOSes, and drivers were all up to date as of the start of the testing. In line with our focus on professional workflows, we kept the processors running stock: overclocking features such as ASUS MCE and MLB were disabled, as was AMD’s PBO. RAM was locked to the maximum CPU-supported frequency, at JEDEC timings: 6400 Mbps for Xeon 600 and Threadripper, and 4800 for Xeon W-3500 processors. Additionally, we left Windows security settings like VBS in their default (enabled) state.

For our CPUs, we tested with every available Xeon 600 processor we had access to, and the most comparable Xeon W-3500 models from the last generation. For AMD, we went with the three Threadripper PRO processors that we thought would make the most interesting points of comparison. Unfortunately, we were not able to test with a 9965WX. We decided to compare against the Threadripper PRO line, rather than the normal Threadrippers, as we thought they better matched the new Xeon 600 products in terms of platform specifications. However, the non-PRO Threadripper processors are a good bit cheaper and, for some use-cases, may be a better comparison. Luckily, those tend to perform almost identically to their respective Threadripper PRO counterparts.

To cover a wide range of possible workflows, we tested with nearly every content creation-focused benchmark we have access to. This includes most of the Puget Bench for Creators suite, five CPU-based renderers, our in-development Unreal Engine benchmarks (both in-engine and engine compilation), and for the Intel processors, Linpack 2024.

Before we dive into the results, we did want to flag that the Threadripper performance we saw was a bit wonky, particularly in Adobe applications. Specifically, the 9985WX performed much better than the other Threadrippers we tested, especially compared to our previous testing. We ran each benchmark 5 times for every configuration, and due to the results, re-ran all of the Threadripper processors again after attempting to pin down the issue through an OS reinstallation, CPU reseats, re-flashing the BIOS, and so on. Ultimately, we are confident in publishing the results at this time, but do plan on revisiting CPU performance in those applications in the near future to determine if those results reflect the reality of OS and application updates or were a quirk of this testing environment.

Graphic Design: Adobe Photoshop

Photoshop is primarily a single-threaded application and not a workload that these processors should be considered for as a primary use-case. Nonetheless, it can be useful to see how performance changes if it is used as a secondary application. Due to this, we will be focusing on the first chart, the Overall score.
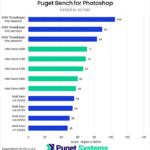
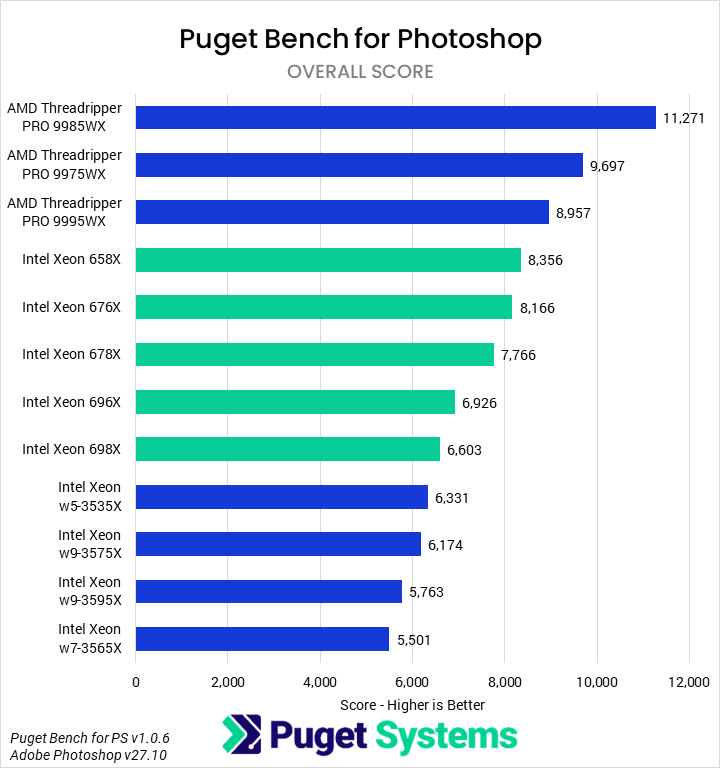
Chart 1: Bar chart of Overall score in Puget Bench for Photoshop, higher is better. The AMD Threadripper PRO 9985WX leads at 11,271. The Intel Xeon 658X is the fastest Xeon 600 chip at 8,356, about 26% behind and 7% behind the Threadripper PRO 9995WX.
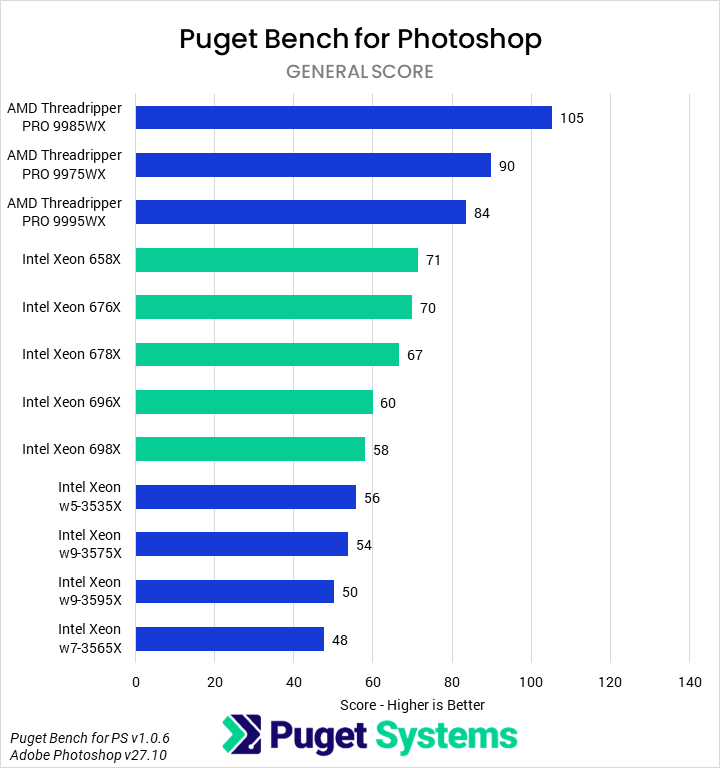
Chart 2: Bar chart of General score in Puget Bench for Photoshop, higher is better. All three AMD Threadripper PRO chips lead at 84 to 105. The Intel Xeon 658X is the fastest Xeon 600 chip at 71, about 32% behind the 9985WX.
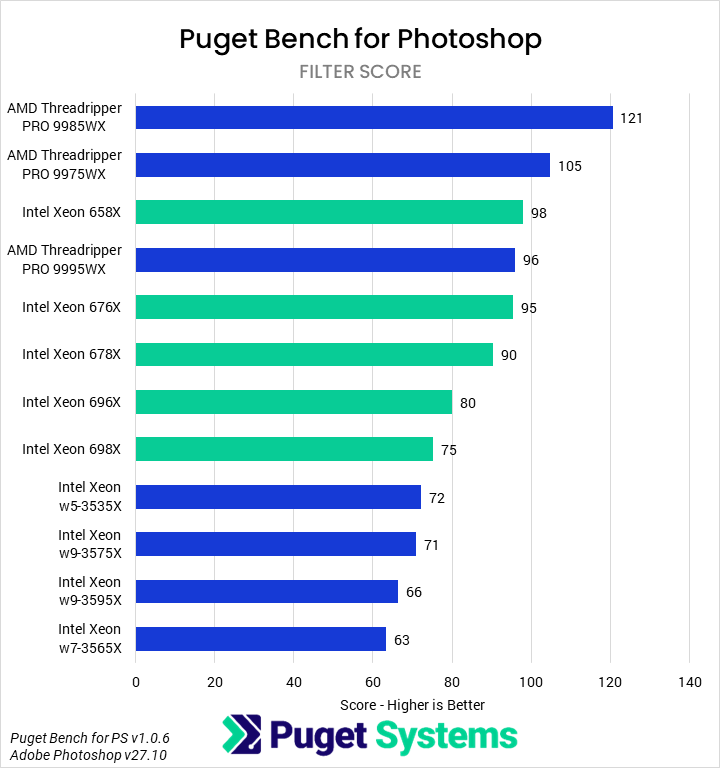
Chart 3: Bar chart of Filter score in Puget Bench for Photoshop, higher is better. The AMD Threadripper PRO 9985WX leads at 121. The Intel Xeon 658X is the fastest Xeon 600 chip at 98, about 19% behind, and all Xeon 600 chips beat every Xeon W-3500 model.
Chart 1: Bar chart of Overall score in Puget Bench for Photoshop, higher is better. The AMD Threadripper PRO 9985WX leads at 11,271. The Intel Xeon 658X is the fastest Xeon 600 chip at 8,356, about 26% behind and 7% behind the Threadripper PRO 9995WX.
Chart 2: Bar chart of General score in Puget Bench for Photoshop, higher is better. All three AMD Threadripper PRO chips lead at 84 to 105. The Intel Xeon 658X is the fastest Xeon 600 chip at 71, about 32% behind the 9985WX.
Chart 3: Bar chart of Filter score in Puget Bench for Photoshop, higher is better. The AMD Threadripper PRO 9985WX leads at 121. The Intel Xeon 658X is the fastest Xeon 600 chip at 98, about 19% behind, and all Xeon 600 chips beat every Xeon W-3500 model.
Previous Next
System Image
Chart 1: Bar chart of Overall score in Puget Bench for Photoshop, higher is better. The AMD Threadripper PRO 9985WX leads at 11,271. The Intel Xeon 658X is the fastest Xeon 600 chip at 8,356, about 26% behind and 7% behind the Threadripper PRO 9995WX.
Open Full Resolution
Chart 2: Bar chart of General score in Puget Bench for Photoshop, higher is better. All three AMD Threadripper PRO chips lead at 84 to 105. The Intel Xeon 658X is the fastest Xeon 600 chip at 71, about 32% behind the 9985WX.
Open Full Resolution
Chart 3: Bar chart of Filter score in Puget Bench for Photoshop, higher is better. The AMD Threadripper PRO 9985WX leads at 121. The Intel Xeon 658X is the fastest Xeon 600 chip at 98, about 19% behind, and all Xeon 600 chips beat every Xeon W-3500 model.
Open Full Resolution
Previous Next

In our Puget Bench for Photoshop Overall score (Chart #1), we found a straightforward grouping of parts, with AMD’s CPUs at the top of the chart, followed by Intel’s Xeon 600 processors, and then the last-gen Xeon W-3500 parts. Looking at Xeon 600, we found that the higher core-count parts performed worse than the lower core-count parts. The 658X was the fastest of the family, with performance gains of 2% over the 676X, 8% over the 678X, 20% over the 696X, and 27% over the 698X. The 24-, 32-, and 48-core parts were largely similar, with the differences really only occurring at 64+ cores. Those higher core count models do have lower maximum boost clock speeds, but not enough lower to explain the performance difference alone.

Compared to the last-gen Intel parts, the new Xeon 600 CPUs showed good generational gains. The 658X was 32% faster than the 20-core 3535X, the 676X 48% faster than the 3565X, the 678X 26% faster than the 44-core 3575X, and the 696X 20% ahead of the 3595X. There wasn’t a high enough core count model in the previous generation for a fair comparison to the 698X.

However, the Xeon 600 processors look somewhat less impressive when compared to AMD. At 32 cores, AMD’s 9975WX was 18% faster than the 32-core 676X; it was also 24% faster than the similarly-priced 678X. The 64-core segment saw the 9985WX lead the 696X by 62% and outperform the same-price 698X by 71%. The 96-core 9995WX was actually somewhat less impressive in this regard, as it only beat the 698X by 35%, despite costing about 50% more.

Workstation-class processors aren’t a great fit for Photoshop, but if it is an important secondary application, we would recommend sticking with either an AMD Threadripper or Threadripper PRO processor — or, if necessary, the lower core-count Xeon 600 processors.

Video Editing: Adobe Premiere

Next in our test suite was Puget Bench for Adobe Premiere, a non-linear editor. Premiere has a healthy mix of single-threaded, multi-threaded, and GPU-accelerated workloads, depending on the task, effect, and processing being done. Typically, an important facet of Intel’s performance in this application would be the highly competent media engines in the iGPU, which support hardware-accelerated processing for LongGOP codecs. However, as Xeon processors lack an integrated GPU, the only relevant factor is the compute power of the CPU cores themselves, and how they work in tandem with an NVIDIA GPU, the latter of which is relevant mostly for the processing of RAW codecs. As such, we will be principally examining performance based on the Overall score, Intraframe score, and RAW codec scores.
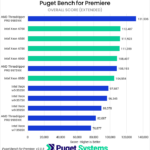
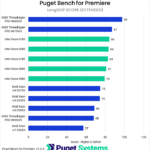
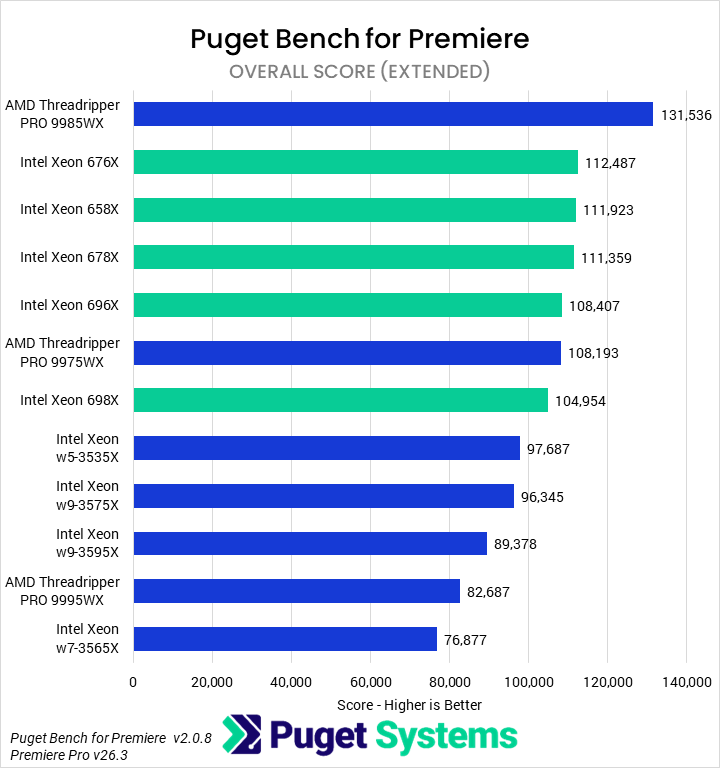
Chart 1: Bar chart of Overall score in Puget Bench for Premiere, higher is better. The AMD Threadripper PRO 9985WX leads at 131,536. The Intel Xeon 676X follows at 112,487, about 14% behind, and every Xeon 600 chip except the 698X edges out the Threadripper PRO 9975WX.
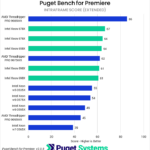
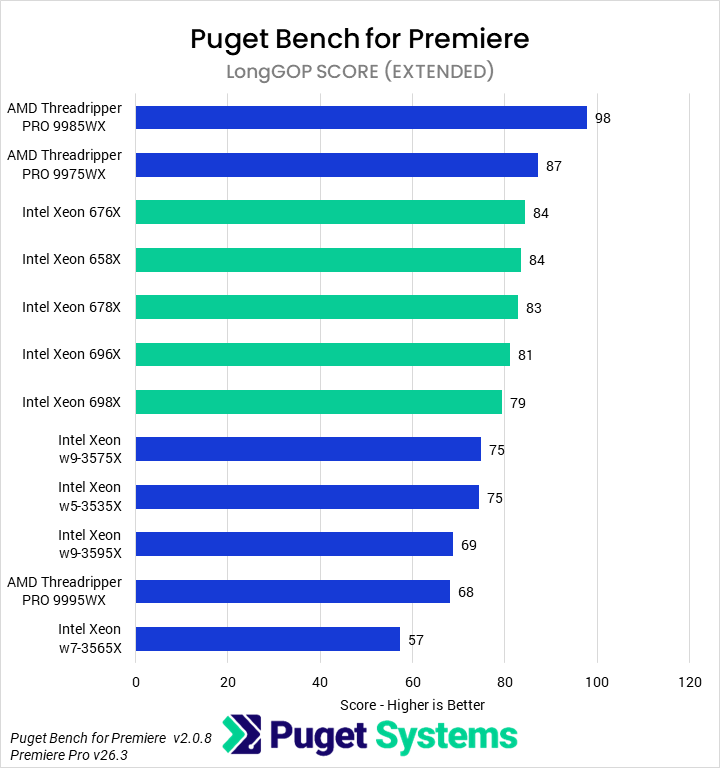
Chart 2: Bar chart of LongGOP score in Puget Bench for Premiere, higher is better. The AMD Threadripper PRO 9985WX leads at 98, ahead of the 9975WX at 87. The Intel Xeon 600 chips score 79 to 84, led by the Xeon 676X and 658X.
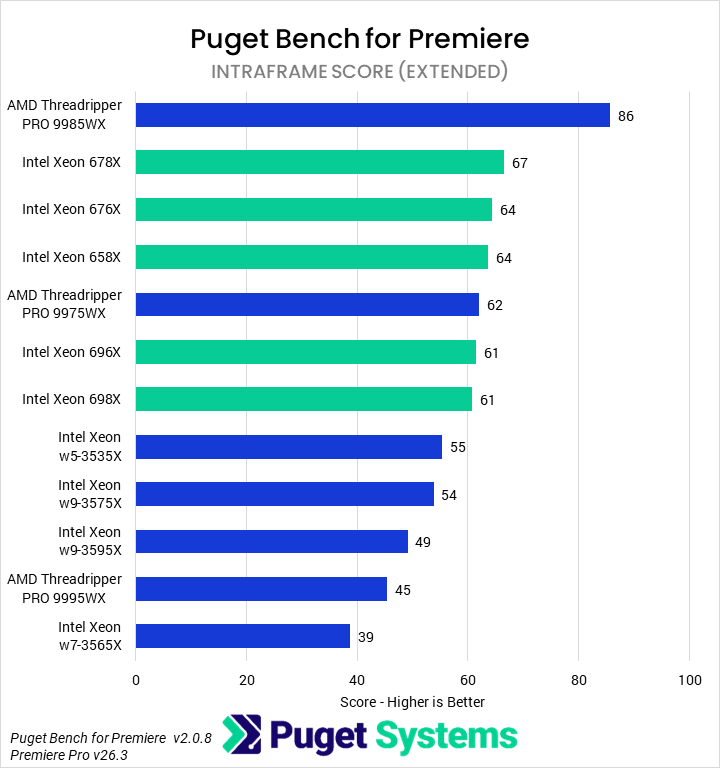
Chart 3: Bar chart of Intraframe score in Puget Bench for Premiere, higher is better. The AMD Threadripper PRO 9985WX leads at 86. The Intel Xeon 600 chips score 61 to 67, led by the Xeon 678X at about 22% behind, and the Xeon w7-3565X is last at 39.
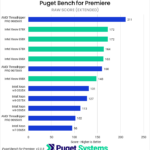
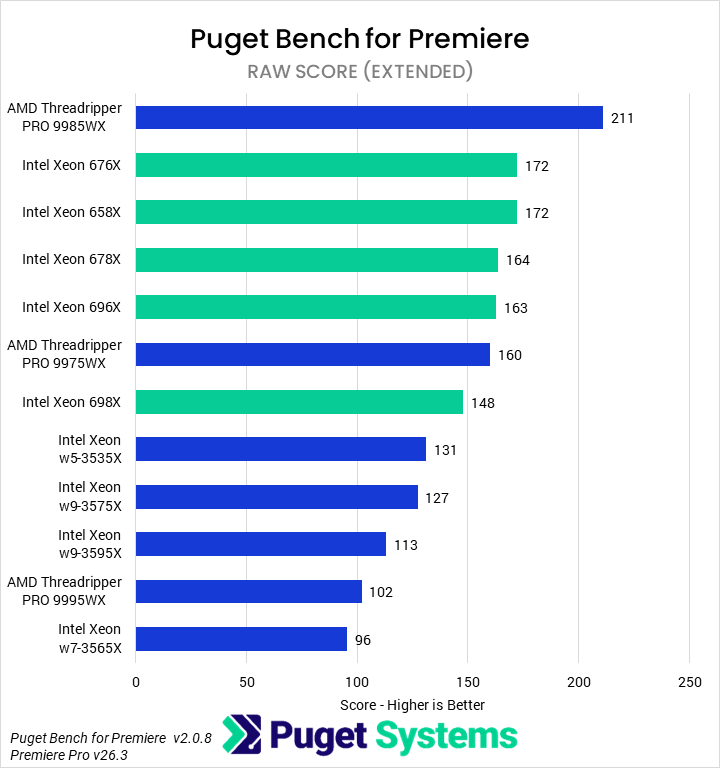
Chart 4: Bar chart of RAW score in Puget Bench for Premiere, higher is better. The AMD Threadripper PRO 9985WX leads at 211. The Intel Xeon 676X and 658X tie for the best Xeon 600 result at 172, about 18% behind, and the Xeon 698X scores 148.
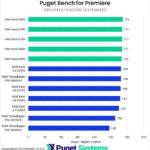
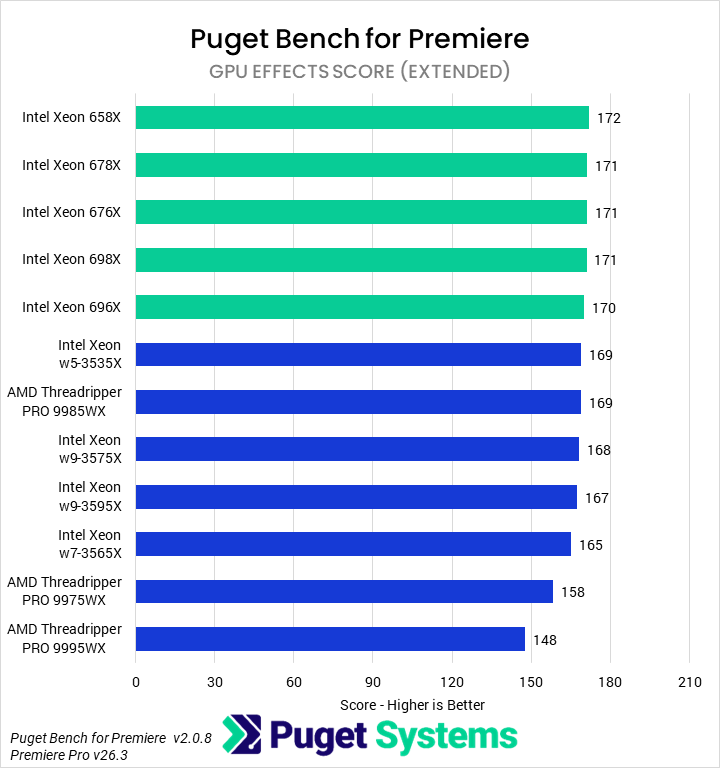
Chart 5: Bar chart of GPU Effects score in Puget Bench for Premiere, higher is better. Results are tightly grouped. The Intel Xeon 600 chips lead at 170 to 172, most others score 165 to 169, and the AMD Threadripper PRO 9975WX and 9995WX trail at 158 and 148.
Chart 1: Bar chart of Overall score in Puget Bench for Premiere, higher is better. The AMD Threadripper PRO 9985WX leads at 131,536. The Intel Xeon 676X follows at 112,487, about 14% behind, and every Xeon 600 chip except the 698X edges out the Threadripper PRO 9975WX.
Chart 2: Bar chart of LongGOP score in Puget Bench for Premiere, higher is better. The AMD Threadripper PRO 9985WX leads at 98, ahead of the 9975WX at 87. The Intel Xeon 600 chips score 79 to 84, led by the Xeon 676X and 658X.
Chart 3: Bar chart of Intraframe score in Puget Bench for Premiere, higher is better. The AMD Threadripper PRO 9985WX leads at 86. The Intel Xeon 600 chips score 61 to 67, led by the Xeon 678X at about 22% behind, and the Xeon w7-3565X is last at 39.
Chart 4: Bar chart of RAW score in Puget Bench for Premiere, higher is better. The AMD Threadripper PRO 9985WX leads at 211. The Intel Xeon 676X and 658X tie for the best Xeon 600 result at 172, about 18% behind, and the Xeon 698X scores 148.
Chart 5: Bar chart of GPU Effects score in Puget Bench for Premiere, higher is better. Results are tightly grouped. The Intel Xeon 600 chips lead at 170 to 172, most others score 165 to 169, and the AMD Threadripper PRO 9975WX and 9995WX trail at 158 and 148.
Previous Next
System Image
Chart 1: Bar chart of Overall score in Puget Bench for Premiere, higher is better. The AMD Threadripper PRO 9985WX leads at 131,536. The Intel Xeon 676X follows at 112,487, about 14% behind, and every Xeon 600 chip except the 698X edges out the Threadripper PRO 9975WX.
Open Full Resolution
Chart 2: Bar chart of LongGOP score in Puget Bench for Premiere, higher is better. The AMD Threadripper PRO 9985WX leads at 98, ahead of the 9975WX at 87. The Intel Xeon 600 chips score 79 to 84, led by the Xeon 676X and 658X.
Open Full Resolution
Chart 3: Bar chart of Intraframe score in Puget Bench for Premiere, higher is better. The AMD Threadripper PRO 9985WX leads at 86. The Intel Xeon 600 chips score 61 to 67, led by the Xeon 678X at about 22% behind, and the Xeon w7-3565X is last at 39.
Open Full Resolution
Chart 4: Bar chart of RAW score in Puget Bench for Premiere, higher is better. The AMD Threadripper PRO 9985WX leads at 211. The Intel Xeon 676X and 658X tie for the best Xeon 600 result at 172, about 18% behind, and the Xeon 698X scores 148.
Open Full Resolution
Chart 5: Bar chart of GPU Effects score in Puget Bench for Premiere, higher is better. Results are tightly grouped. The Intel Xeon 600 chips lead at 170 to 172, most others score 165 to 169, and the AMD Threadripper PRO 9975WX and 9995WX trail at 158 and 148.
Open Full Resolution
Previous Next

Starting with the Overall score (Chart #1), the Xeon 600 processors performed well, with most of them sitting towards the top of the chart. All three of the 676X, 658X, and 678X performed almost identically, 17% behind the 9985WX and 3% ahead of the 696X. This represents about a 5% gen-on-gen performance gain, except for the 3565X → 676X, which was much larger. The 696X tied the 9975WX and led the 698X by 3%, while seeing a 21% uplift over the last-gen 3595X. Interestingly, the 698X was the slowest Xeon 600 CPU, though it did solidly outperform the 9995WX.

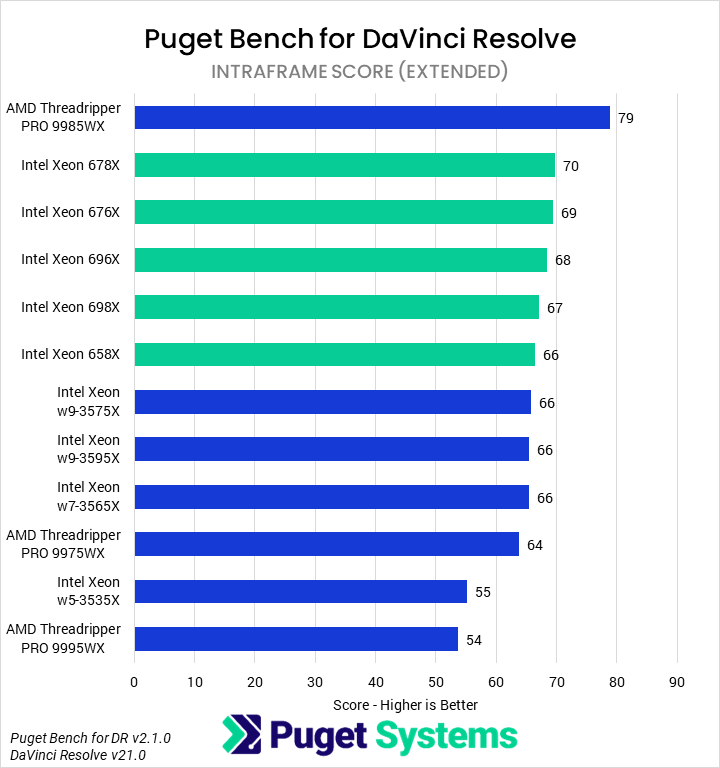
Moving on to the Intraframe score (Chart #3), we found that the 9985WX was again the performance king, this time beating the next-fastest processor by 28%. However, Intel otherwise kept up. The 48-core 678X was the next-fastest processor, beating the 676X and 658X by 5% and the 9975WX by 8%. The 64-core 696X and 86-core 698X trailed slightly behind the 9975WX, but did still beat out all of the last-generation Xeons by at least 11%, as well as the 9995WX.

When testing with RAW codecs (Chart #4), AMD’s 9985WX once again topped the chart, beating the 676X and 658X by 23%. Following them were the 678X and 696X, 5% slower but 2% faster than the 9975WX. The 698X rounded out the bottom of the current-gen processors, trailing the 9975WX by 8% and beating the fastest last-gen Xeon, the 3535X, by 13%. Overall, the new Xeon CPUs saw generational improvements of 30-40%.

Motion Graphics: Adobe After Effects

The final Adobe application we tested for this review was After Effects. AE has been an interesting program to test over the last few years as it added support for heavy multi-threaded workflows with MFR and then expanded to handle 3D workflows, with those being heavily dependent on GPU performance.
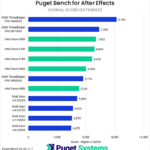
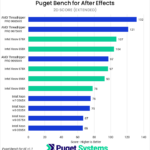
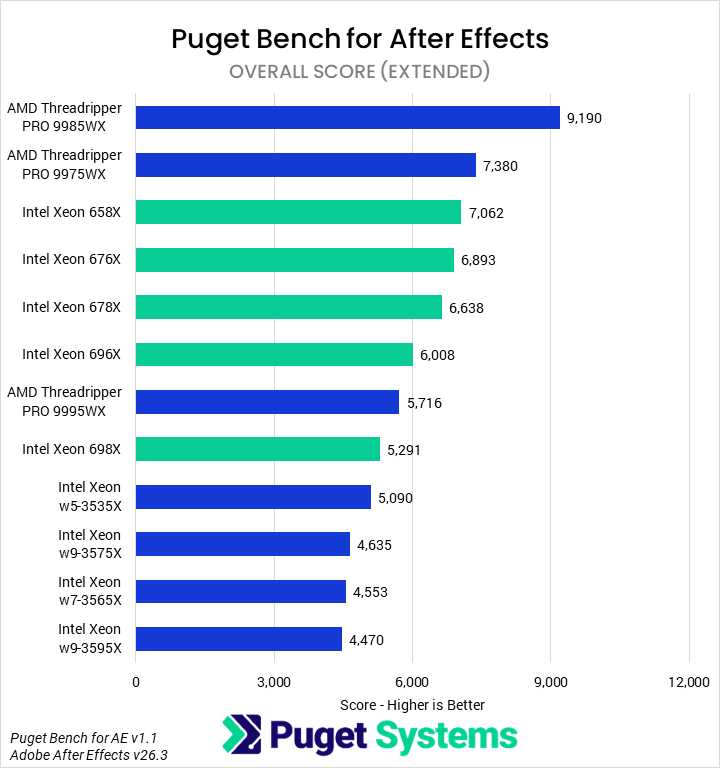
Chart 1: Bar chart of Overall score in Puget Bench for After Effects, higher is better. The AMD Threadripper PRO 9985WX leads at 9,190. The fastest Intel Xeon 600 chip is the Xeon 658X at 7,062, about 23% behind, and the Xeon 698X scores 5,291.
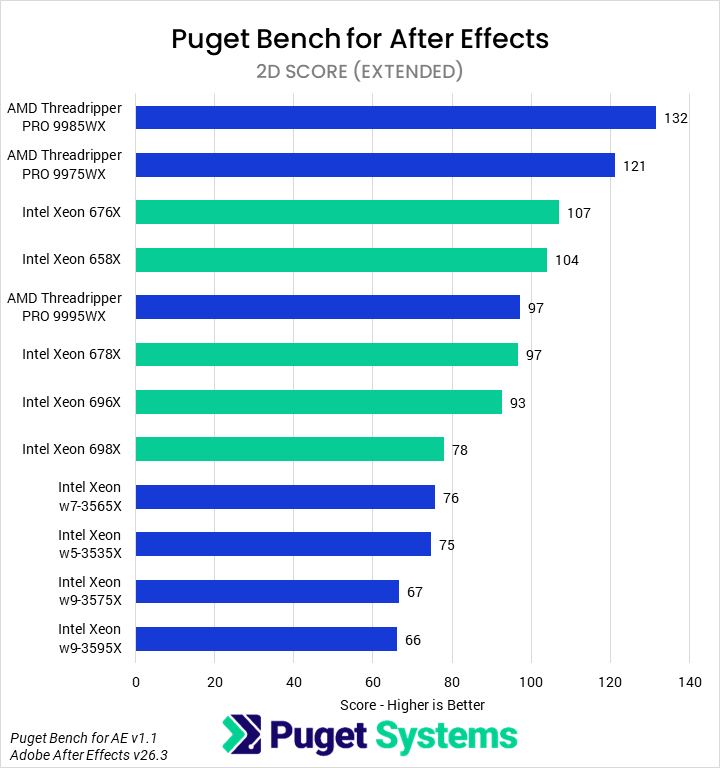
Chart 2: Bar chart of 2D score in Puget Bench for After Effects, higher is better. The AMD Threadripper PRO 9985WX leads at 132. The fastest Intel Xeon 600 chip is the Xeon 676X at 107, about 19% behind, and the Xeon 698X scores 78.
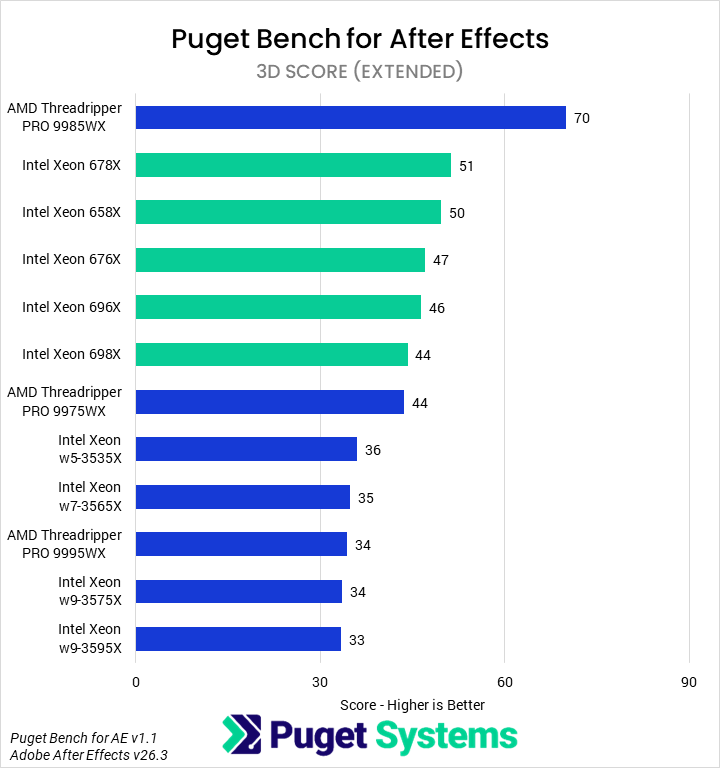
Chart 3: Bar chart of 3D score in Puget Bench for After Effects, higher is better. The AMD Threadripper PRO 9985WX leads at 70. The Intel Xeon 600 chips score 44 to 51, led by the Xeon 678X, ahead of all Xeon W-3500 models at 33 to 36.
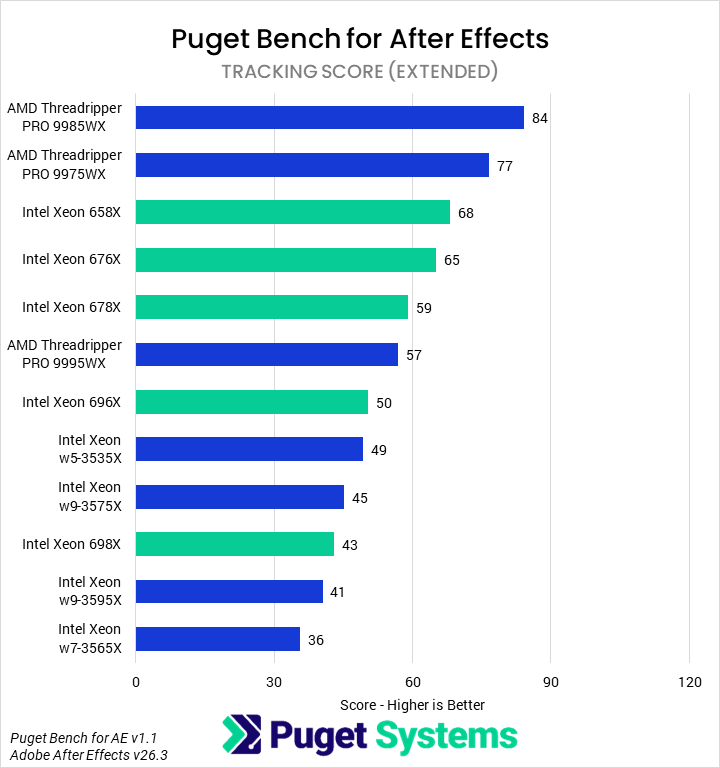
Chart 4: Bar chart of Tracking score in Puget Bench for After Effects, higher is better. The AMD Threadripper PRO 9985WX leads at 84. The Intel Xeon 658X is the fastest Xeon 600 chip at 68, about 19% behind, and the Xeon 698X scores 43.
Chart 1: Bar chart of Overall score in Puget Bench for After Effects, higher is better. The AMD Threadripper PRO 9985WX leads at 9,190. The fastest Intel Xeon 600 chip is the Xeon 658X at 7,062, about 23% behind, and the Xeon 698X scores 5,291.
Chart 2: Bar chart of 2D score in Puget Bench for After Effects, higher is better. The AMD Threadripper PRO 9985WX leads at 132. The fastest Intel Xeon 600 chip is the Xeon 676X at 107, about 19% behind, and the Xeon 698X scores 78.
Chart 3: Bar chart of 3D score in Puget Bench for After Effects, higher is better. The AMD Threadripper PRO 9985WX leads at 70. The Intel Xeon 600 chips score 44 to 51, led by the Xeon 678X, ahead of all Xeon W-3500 models at 33 to 36.
Chart 4: Bar chart of Tracking score in Puget Bench for After Effects, higher is better. The AMD Threadripper PRO 9985WX leads at 84. The Intel Xeon 658X is the fastest Xeon 600 chip at 68, about 19% behind, and the Xeon 698X scores 43.
Previous Next
System Image
Chart 1: Bar chart of Overall score in Puget Bench for After Effects, higher is better. The AMD Threadripper PRO 9985WX leads at 9,190. The fastest Intel Xeon 600 chip is the Xeon 658X at 7,062, about 23% behind, and the Xeon 698X scores 5,291.
Open Full Resolution
Chart 2: Bar chart of 2D score in Puget Bench for After Effects, higher is better. The AMD Threadripper PRO 9985WX leads at 132. The fastest Intel Xeon 600 chip is the Xeon 676X at 107, about 19% behind, and the Xeon 698X scores 78.
Open Full Resolution
Chart 3: Bar chart of 3D score in Puget Bench for After Effects, higher is better. The AMD Threadripper PRO 9985WX leads at 70. The Intel Xeon 600 chips score 44 to 51, led by the Xeon 678X, ahead of all Xeon W-3500 models at 33 to 36.
Open Full Resolution
Chart 4: Bar chart of Tracking score in Puget Bench for After Effects, higher is better. The AMD Threadripper PRO 9985WX leads at 84. The Intel Xeon 658X is the fastest Xeon 600 chip at 68, about 19% behind, and the Xeon 698X scores 43.
Open Full Resolution
Previous Next

Based on the Overall score (Chart #1), Intel’s new Xeon 600 processors fail to displace AMD’s Threadripper processors from the top spots. Both the 9985WX and 9975WX outpaced the fastest Xeon, the 658X, by 30% and 5%, respectively. The 676X was, in turn, 3% slower than the 658X, though 4% faster than the 678X. All three of those are likely within the margin of error of this testing. The higher core-count parts once again performed relatively poorly: the 696X and 698X bounded the 9995WX on either side, with the former 10% behind the 678X and the latter 15% slower than the 678X and 7% behind the Threadripper. However, even the 698X outperformed the fastest Xeon W-3500 chip by 4%, and overall, we observed that the Xeon 600 CPUs were 40-50% faster than their last-gen counterparts.

In our After Effects benchmark, the 2D score (Chart #2) tends to be the most sensitive to multi-core CPU performance of all of the major subscores, though it still includes largely single-threaded portions. Our testing put the 9985WX in the lead again, 9% faster than the 9975WX and 23% faster than the top Xeon processor, the 676X. After the 676X was the 658X, trailing by just 3%. The 9995WX and 678X were tied: 7% slower than the 676X, though 4% ahead of the 696X. Finally, the 968X rounded out the current-gen processors, 16% behind the 696X and only 3% ahead of the 3565X. Generationally, the Xeon processors saw about a 40% uplift.

The last CPU-dominated area in After Effects is tracking (Chart #4). These scores track very closely to the overall score, such that the 9985WX is the fastest processor we tested, followed by the 9975WX and 658X, with the latter being 24% and 13% slower than those, respectively. 4% behind the 658X was the 676X, which led the 678X by 10% and the 9995WX by 14%. Intel’s new 696X was 12% slower than the 9995WX, barely beating the 3535X and 3575X, with the 698X coming next. Overall, the tracking performance of the new Xeons is decent, but offers neither the best value or performance.

Video Editing/Motion Graphics: DaVinci Resolve Studio

DaVinci Resolve Studio has grown over the years, and now supports a large number of workflows, but our benchmark focuses on two primary areas: the non-linear editor, similar to Premiere, and the Fusion page, similar to After Effects. Blackmagic has also added a lot of Neural Engine capabilities, from masking to audio transcription to upscaling, and we examine some of those as well. Since the goal here is comparing CPU performance, we will focus primarily on the Overall score, the RAW score, the AI score, and the Fusion score, although all of the major subscores are in the carousel below.
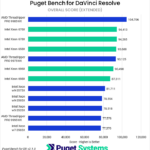
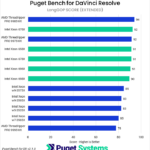
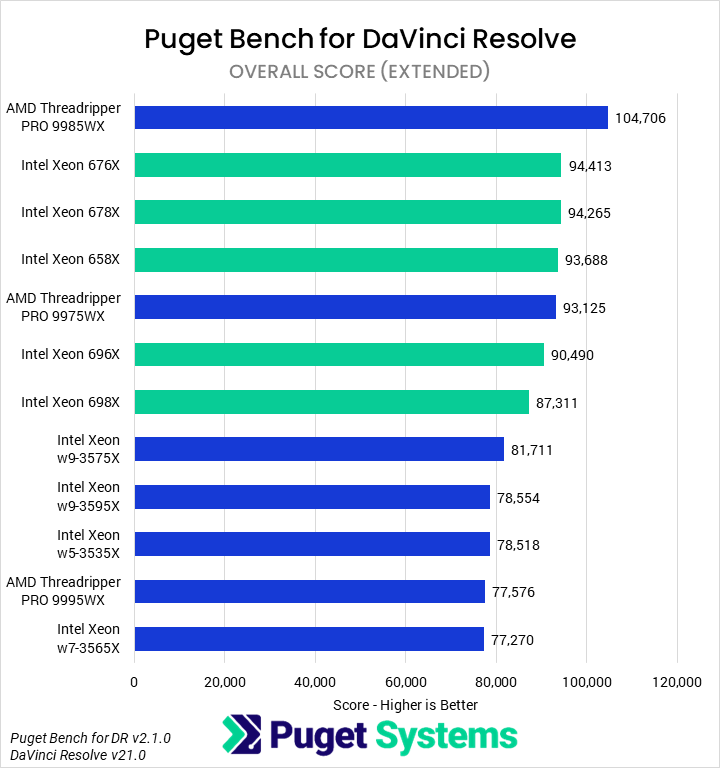
Chart 1: Bar chart of Overall score in Puget Bench for DaVinci Resolve, higher is better. The AMD Threadripper PRO 9985WX leads at 104,706. The Intel Xeon 676X, 678X, and 658X follow at about 94,000, roughly 10% behind and just ahead of the Threadripper PRO 9975WX.
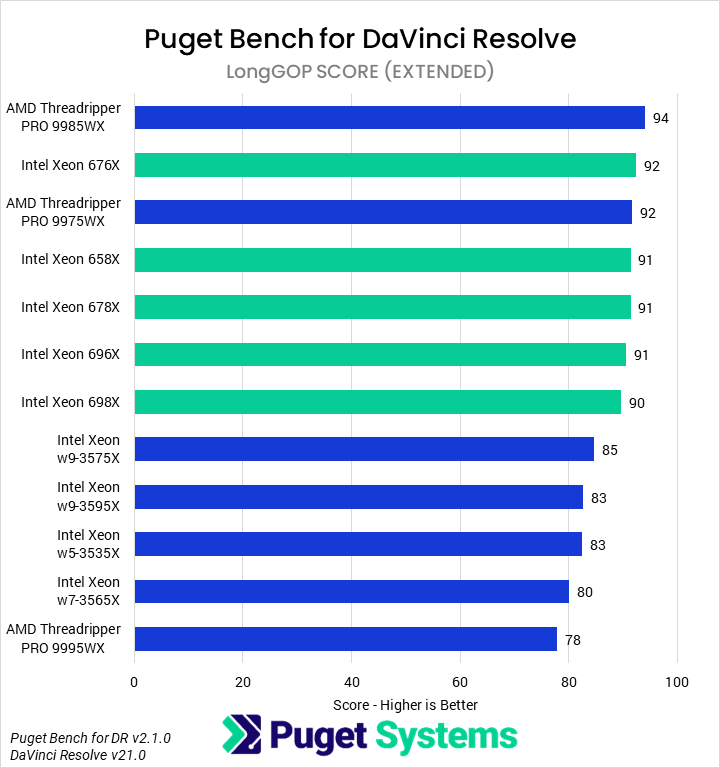
Chart 2: Bar chart of LongGOP score in Puget Bench for DaVinci Resolve, higher is better. The AMD Threadripper PRO 9985WX leads at 94, but results are tightly grouped, with all Intel Xeon 600 chips at 90 to 92. The Threadripper PRO 9995WX is last at 78.
Chart 3: Bar chart of Intraframe score in Puget Bench for DaVinci Resolve, higher is better. The AMD Threadripper PRO 9985WX leads at 79. The Intel Xeon 600 chips score 66 to 70, led by the Xeon 678X at about 11% behind. The Threadripper PRO 9995WX is last at 54.
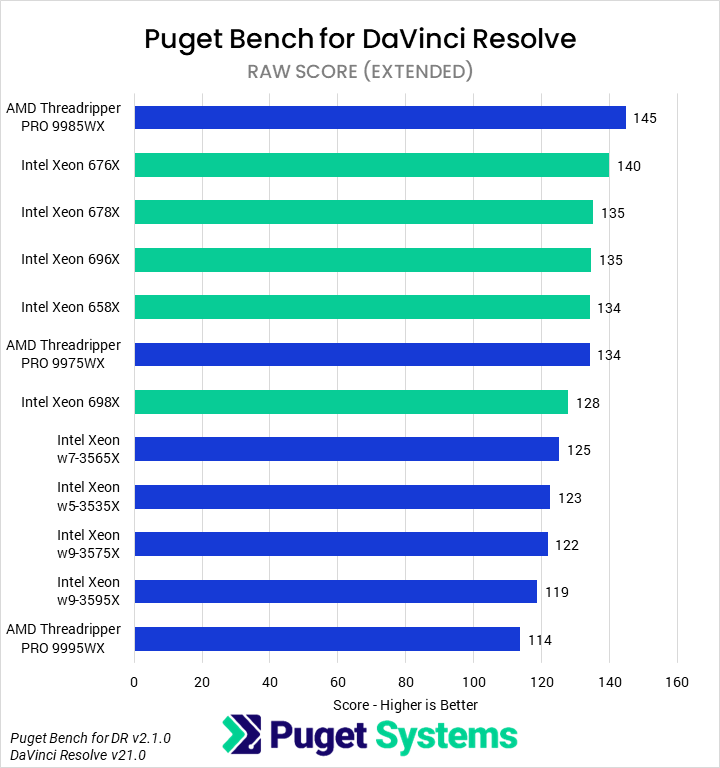
Chart 4: Bar chart of RAW score in Puget Bench for DaVinci Resolve, higher is better. The AMD Threadripper PRO 9985WX leads at 145, with the Intel Xeon 676X about 3% behind at 140. The Threadripper PRO 9995WX is last at 114.
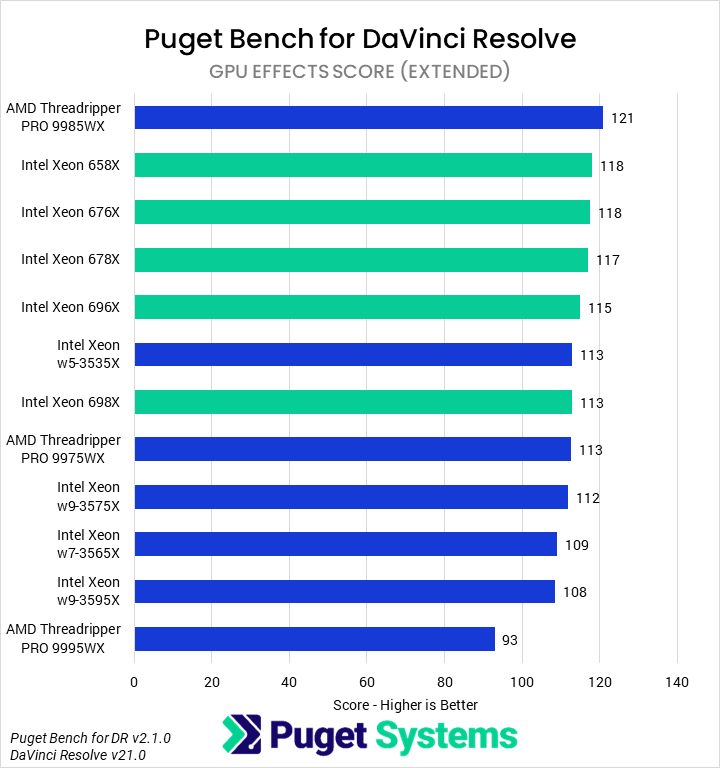
Chart 5: Bar chart of GPU Effects score in Puget Bench for DaVinci Resolve, higher is better. The AMD Threadripper PRO 9985WX leads at 121, with the Intel Xeon 658X and 676X close behind at 118. The Threadripper PRO 9995WX is last at 93.
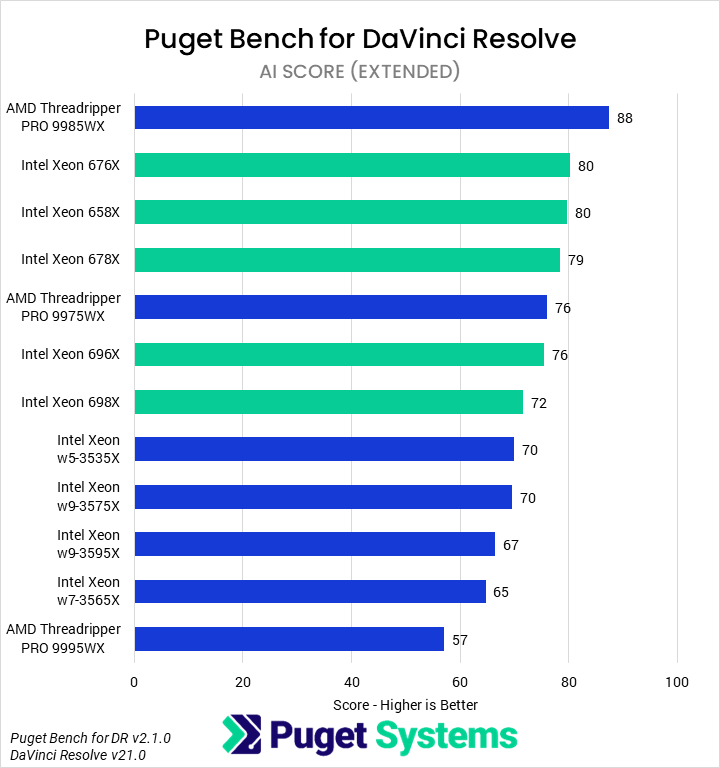
Chart 6: Bar chart of AI score in Puget Bench for DaVinci Resolve, higher is better. The AMD Threadripper PRO 9985WX leads at 88, followed by the Intel Xeon 676X and 658X at 80. The Threadripper PRO 9995WX is last at 57.
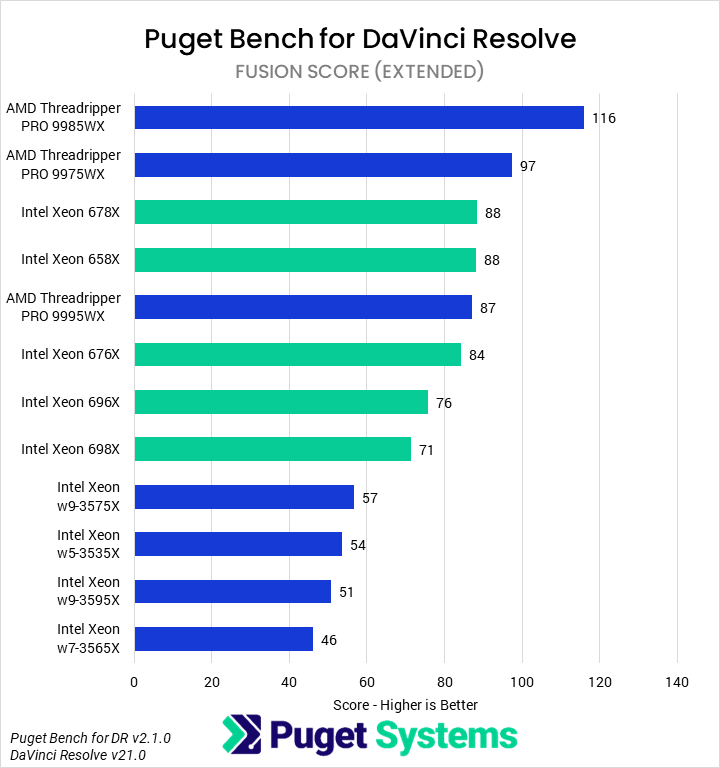
Chart 7: Bar chart of Fusion score in Puget Bench for DaVinci Resolve, higher is better. The AMD Threadripper PRO 9985WX leads at 116. The fastest Intel Xeon 600 chips are the Xeon 678X and 658X at 88, about 24% behind.
Chart 1: Bar chart of Overall score in Puget Bench for DaVinci Resolve, higher is better. The AMD Threadripper PRO 9985WX leads at 104,706. The Intel Xeon 676X, 678X, and 658X follow at about 94,000, roughly 10% behind and just ahead of the Threadripper PRO 9975WX.
Chart 2: Bar chart of LongGOP score in Puget Bench for DaVinci Resolve, higher is better. The AMD Threadripper PRO 9985WX leads at 94, but results are tightly grouped, with all Intel Xeon 600 chips at 90 to 92. The Threadripper PRO 9995WX is last at 78.
Chart 3: Bar chart of Intraframe score in Puget Bench for DaVinci Resolve, higher is better. The AMD Threadripper PRO 9985WX leads at 79. The Intel Xeon 600 chips score 66 to 70, led by the Xeon 678X at about 11% behind. The Threadripper PRO 9995WX is last at 54.
Chart 4: Bar chart of RAW score in Puget Bench for DaVinci Resolve, higher is better. The AMD Threadripper PRO 9985WX leads at 145, with the Intel Xeon 676X about 3% behind at 140. The Threadripper PRO 9995WX is last at 114.
Chart 5: Bar chart of GPU Effects score in Puget Bench for DaVinci Resolve, higher is better. The AMD Threadripper PRO 9985WX leads at 121, with the Intel Xeon 658X and 676X close behind at 118. The Threadripper PRO 9995WX is last at 93.
Chart 6: Bar chart of AI score in Puget Bench for DaVinci Resolve, higher is better. The AMD Threadripper PRO 9985WX leads at 88, followed by the Intel Xeon 676X and 658X at 80. The Threadripper PRO 9995WX is last at 57.
Chart 7: Bar chart of Fusion score in Puget Bench for DaVinci Resolve, higher is better. The AMD Threadripper PRO 9985WX leads at 116. The fastest Intel Xeon 600 chips are the Xeon 678X and 658X at 88, about 24% behind.
Previous Next
System Image
Chart 1: Bar chart of Overall score in Puget Bench for DaVinci Resolve, higher is better. The AMD Threadripper PRO 9985WX leads at 104,706. The Intel Xeon 676X, 678X, and 658X follow at about 94,000, roughly 10% behind and just ahead of the Threadripper PRO 9975WX.
Open Full Resolution
Chart 2: Bar chart of LongGOP score in Puget Bench for DaVinci Resolve, higher is better. The AMD Threadripper PRO 9985WX leads at 94, but results are tightly grouped, with all Intel Xeon 600 chips at 90 to 92. The Threadripper PRO 9995WX is last at 78.
Open Full Resolution
Chart 3: Bar chart of Intraframe score in Puget Bench for DaVinci Resolve, higher is better. The AMD Threadripper PRO 9985WX leads at 79. The Intel Xeon 600 chips score 66 to 70, led by the Xeon 678X at about 11% behind. The Threadripper PRO 9995WX is last at 54.
Open Full Resolution
Chart 4: Bar chart of RAW score in Puget Bench for DaVinci Resolve, higher is better. The AMD Threadripper PRO 9985WX leads at 145, with the Intel Xeon 676X about 3% behind at 140. The Threadripper PRO 9995WX is last at 114.
Open Full Resolution
Chart 5: Bar chart of GPU Effects score in Puget Bench for DaVinci Resolve, higher is better. The AMD Threadripper PRO 9985WX leads at 121, with the Intel Xeon 658X and 676X close behind at 118. The Threadripper PRO 9995WX is last at 93.
Open Full Resolution
Chart 6: Bar chart of AI score in Puget Bench for DaVinci Resolve, higher is better. The AMD Threadripper PRO 9985WX leads at 88, followed by the Intel Xeon 676X and 658X at 80. The Threadripper PRO 9995WX is last at 57.
Open Full Resolution
Chart 7: Bar chart of Fusion score in Puget Bench for DaVinci Resolve, higher is better. The AMD Threadripper PRO 9985WX leads at 116. The fastest Intel Xeon 600 chips are the Xeon 678X and 658X at 88, about 24% behind.
Open Full Resolution
Previous Next

Beginning with the Overall score (Chart #1), Intel’s new Xeon 600 processors were unable to unseat AMD from the top spot in DaVinci Resolve, with the 9985WX outperforming the top Intel processor by 11%. The next four CPUs all performed well within the margin of error for this benchmark, with Intel being well represented by the 676X, 678X, and 658X, all edging out the 9975WX. The 696X came in 3% behind the 9975WX, beating out the 698X by 4%. After the 698X were all of the last-gen Xeon W-3500X parts and the 96-core Threadripper. We saw average generational gains for Intel of about 20%.

Next, examining the RAW codec score (Chart #4), we found that the 9985WX once again led the pack. However, the margins were much smaller. The 9985WX was only 4% faster than the 676X, which was itself 4% faster than the 678X. Intel’s 678X, 696X, and 658X, alongside the 9975WX, all performed the same, leading the 698X by 5%. After the 698X were the last-gen Xeon parts and the 9995WX, representing an average generational improvement of about 10%.

Moving on to the AI score (Chart #6), AMD’s 9985WX was again the fastest processor, followed by the 676X, 658X, and 678X, each about 10% slower than the 9985WX. The 678X was itself 4% faster than the 9975WX and 696X, which scored the same. The 698X rounded out the Xeon 600 parts, coming in 5% slower than the 696X and 3% faster than any of the last-gen Xeon CPUs.

Finally, we have the Fusion tab in DaVinci Resolve (Chart #7). Compared to any other section, this is where the Intel processors were at their weakest, with the 9985WX and 9975WX taking the top spots, with scores 32% and 10% higher than the 678X (and 658X), respectively. The 9995WX, which otherwise performed rather poorly in this round of testing, just trailed the 658X by 1%, beating the 676X by 4%. After the 676X, the scores fell more quickly, with the 696X 10% slower and the 698X 7% slower than that. Even with the poor performance relative to AMD, though, the new processors were dramatically better than their last-gen counterparts, with generational uplifts starting at 50% and going up to 82%.

Game Dev/Coding: Unreal Engine & Visual Studio

Although many people may think of Unreal Engine as a primarily GPU-driven software, due to its heavy use in real-time rendering workflows such as video games and virtual production, there are still lots of tasks, particularly in game development, where the CPU has a large impact on performance. One part of our in-house Unreal Engine benchmark looks at these CPU tasks, including compiling shaders, building lighting, and compiling the engine itself in Visual Studio. Although many of these tasks are becoming less common, they can still be major time sinks for some teams.
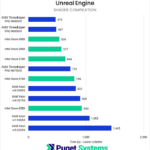
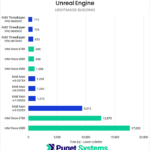
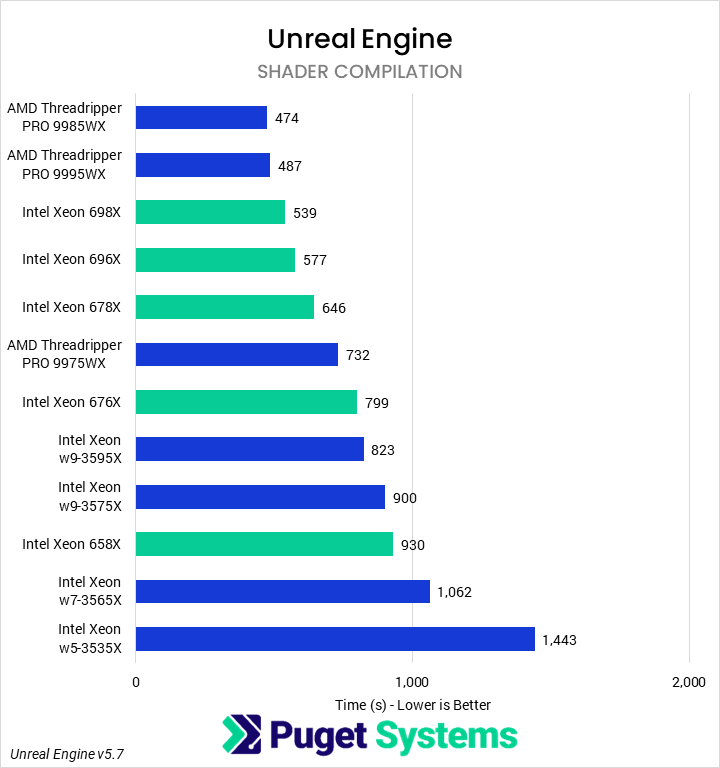
Chart 1: Bar chart of shader compilation time in seconds in Unreal Engine, lower is better. The AMD Threadripper PRO 9985WX is fastest at 474 seconds. The Intel Xeon 698X is the fastest Xeon 600 chip at 539, about 14% longer.
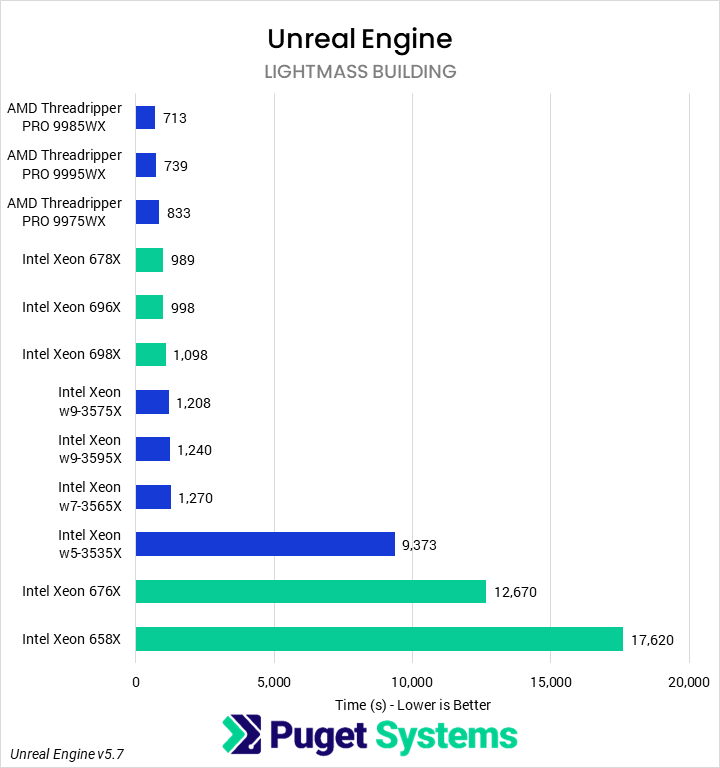
Chart 2: Bar chart of Lightmass build time in seconds in Unreal Engine, lower is better. Most CPUs finish in 713 to 1,270 seconds, led by the AMD Threadripper PRO 9985WX. The Intel Xeon w5-3535X, 676X, and 658X take 9,373 to 17,620 seconds.
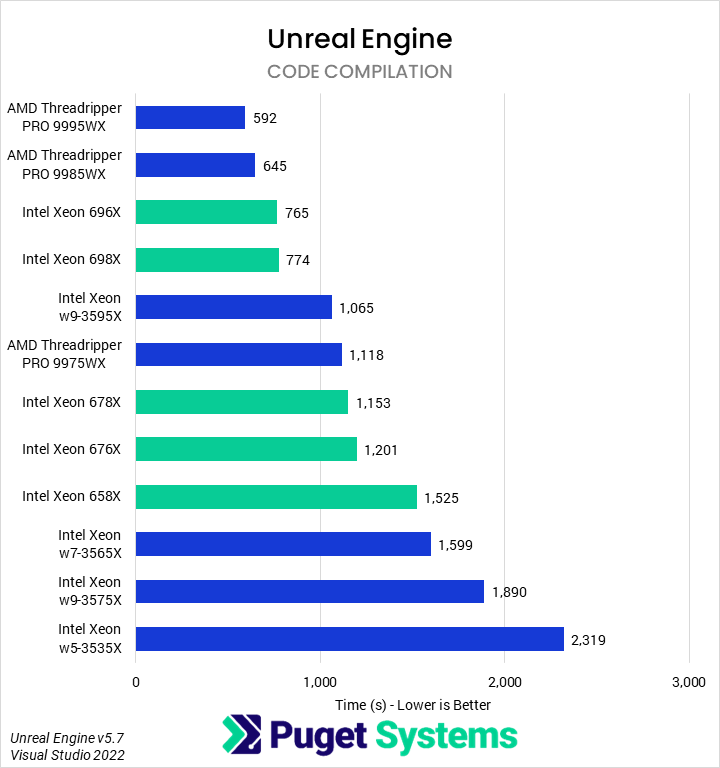
Chart 3: Bar chart of code compilation time in seconds in Unreal Engine, lower is better. The AMD Threadripper PRO 9995WX is fastest at 592 seconds. The Intel Xeon 696X and 698X follow at 765 and 774, about 30% longer.
Chart 1: Bar chart of shader compilation time in seconds in Unreal Engine, lower is better. The AMD Threadripper PRO 9985WX is fastest at 474 seconds. The Intel Xeon 698X is the fastest Xeon 600 chip at 539, about 14% longer.
Chart 2: Bar chart of Lightmass build time in seconds in Unreal Engine, lower is better. Most CPUs finish in 713 to 1,270 seconds, led by the AMD Threadripper PRO 9985WX. The Intel Xeon w5-3535X, 676X, and 658X take 9,373 to 17,620 seconds.
Chart 3: Bar chart of code compilation time in seconds in Unreal Engine, lower is better. The AMD Threadripper PRO 9995WX is fastest at 592 seconds. The Intel Xeon 696X and 698X follow at 765 and 774, about 30% longer.
Previous Next
System Image
Chart 1: Bar chart of shader compilation time in seconds in Unreal Engine, lower is better. The AMD Threadripper PRO 9985WX is fastest at 474 seconds. The Intel Xeon 698X is the fastest Xeon 600 chip at 539, about 14% longer.
Open Full Resolution
Chart 2: Bar chart of Lightmass build time in seconds in Unreal Engine, lower is better. Most CPUs finish in 713 to 1,270 seconds, led by the AMD Threadripper PRO 9985WX. The Intel Xeon w5-3535X, 676X, and 658X take 9,373 to 17,620 seconds.
Open Full Resolution
Chart 3: Bar chart of code compilation time in seconds in Unreal Engine, lower is better. The AMD Threadripper PRO 9995WX is fastest at 592 seconds. The Intel Xeon 696X and 698X follow at 765 and 774, about 30% longer.
Open Full Resolution
Previous Next

The first area of Unreal Engine performance we looked at was in-engine shader compilation (Chat #1). We found that Intel performed well, with large gen-on-gen gains, but the new Xeons failed to fully match the performance of AMD’s Threadripper PRO processors. The fastest Xeon was the 698X, which was 10% slower than the 9995WX and 13% slower than the 9985WX. 7% behind the 698X was the 696X, which was 18% behind the 9985WX but did see roughly 30% performance gains over the older 3595X. Impressively, we found that the next fastest processor was the 678X, outperforming the 9975WX by 12% and the last-gen 3575X by nearly 30%. The 676X and 658X don’t have great comparisons given the Threadripper processors we tested, but they did show 30-40% gains gen-on-gen.

Moving on to light baking (Chart #2), the AMD processors all beat even the fastest Xeon and, as we have observed in previous testing, the Intel processors sometimes performed very badly in this benchmark. Overall, the fastest Xeon, the 678X, was 15% slower than the slowest Threadripper. However, gen-on-gen, Intel did see about 20% faster results.

Finally, we tested Unreal Engine compilation time in Visual Studio 2022 (Chart #3). Like the last two tests, AMD did have the fastest two processors in this workload, but Intel was fairly competitive. The fastest Intel processors were the 696X and 698X, which were 15% behind the 9985WX and nearly 30% faster than the last-gen 3595X and 9975WX. The 678X, despite costing slightly less than the 9975WX, nearly matched it in performance, while the 676X was 12% slower. Finally, the 658X performed much more in line with the rest of the older Xeons, 20% slower than the 676X. Overall, generation gains were between 30 and 40%.

CPU Rendering: Cinebench, V-Ray, Blender, KeyShot, & Corona

There are a wide variety of offline, CPU-based renderers used in the industry, and we are continually looking to include more in our testing. We have long used Cinebench (an industry-standard CPU benchmark as well as being representative of the Cinema 4D renderer), V-Ray, and Blender, but recently added KeyShot and Corona to our testing suite. Corona is commonly used for architectural visualizations, while KeyShot is heavily used in the product visualization space. Although many of these also support GPU rendering, which can often provide superior performance, CPU-based rendering remains an important workflow for many users.
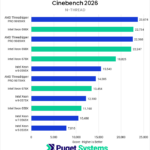
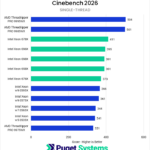
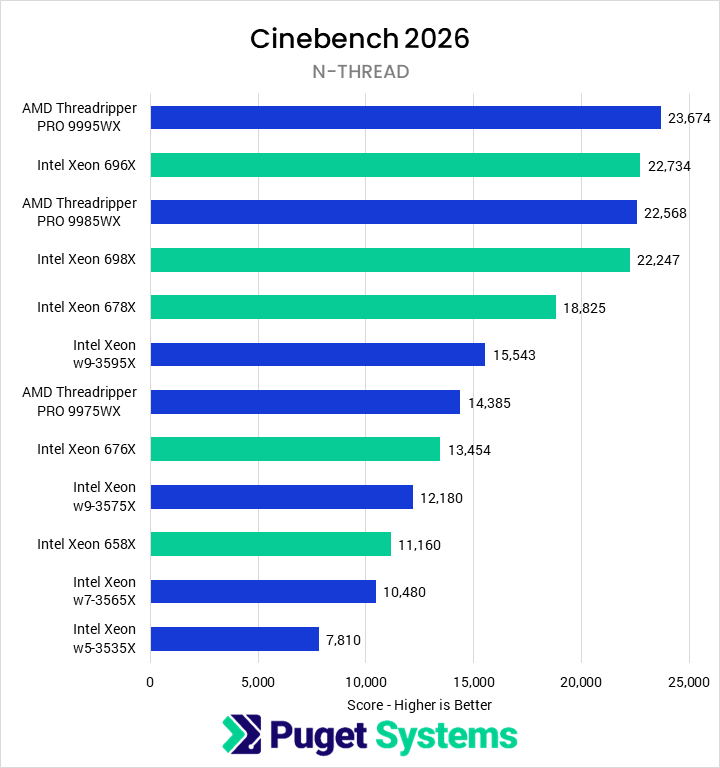
Chart 1: Bar chart of multi-threaded (N-thread) score in Cinebench 2026, higher is better. The AMD Threadripper PRO 9995WX leads at 23,674. The Intel Xeon 696X is about 4% behind at 22,734, ahead of the Threadripper PRO 9985WX and the Xeon 698X.
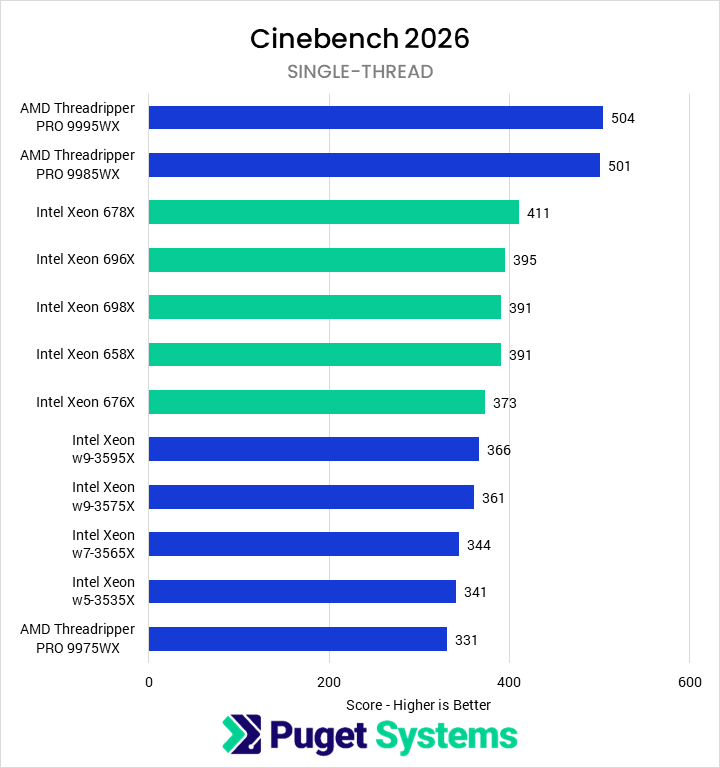
Chart 2: Bar chart of single-threaded score in Cinebench 2026, higher is better. The AMD Threadripper PRO 9995WX and 9985WX lead at 504 and 501. The Intel Xeon 600 chips score 373 to 411, led by the Xeon 678X at about 18% behind.
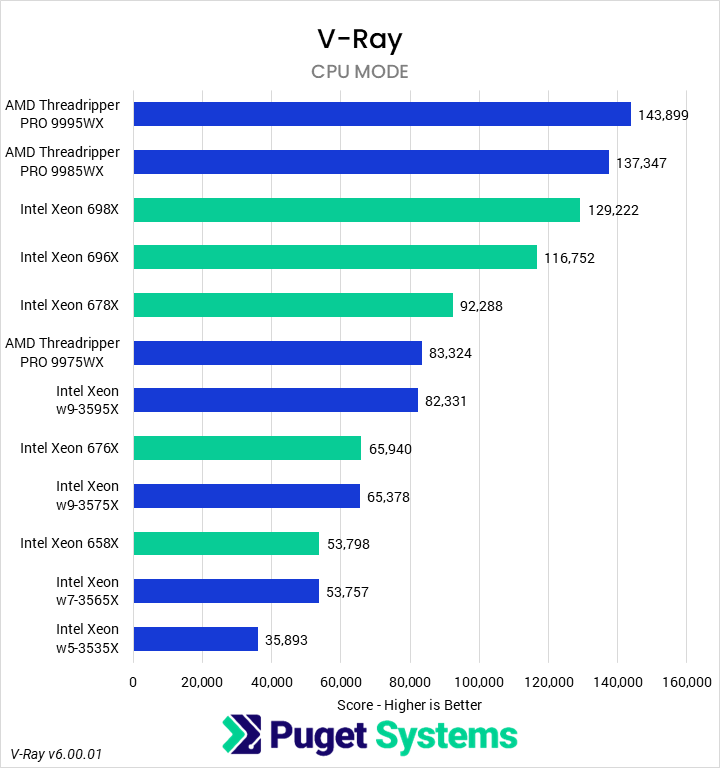
Chart 3: Bar chart of CPU mode score in V-Ray, higher is better. The AMD Threadripper PRO 9995WX leads at 143,899. The Intel Xeon 698X follows the 9985WX at 129,222, about 10% behind the 9995WX.
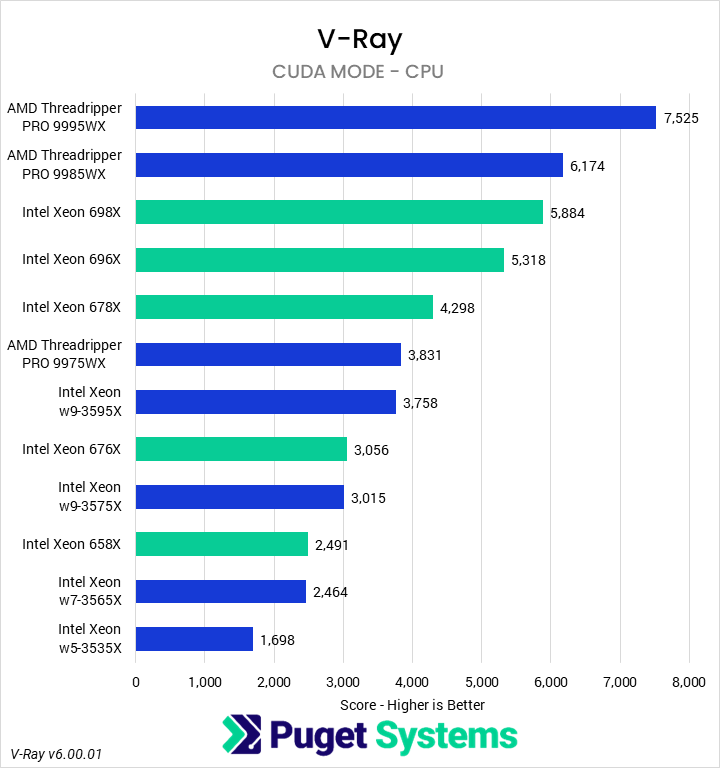
Chart 4: Bar chart of CUDA mode score running on the CPU in V-Ray, higher is better. The AMD Threadripper PRO 9995WX leads at 7,525. The Intel Xeon 698X is the fastest Xeon 600 chip at 5,884, about 22% behind and 5% behind the 9985WX.
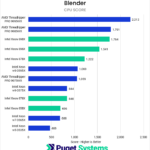
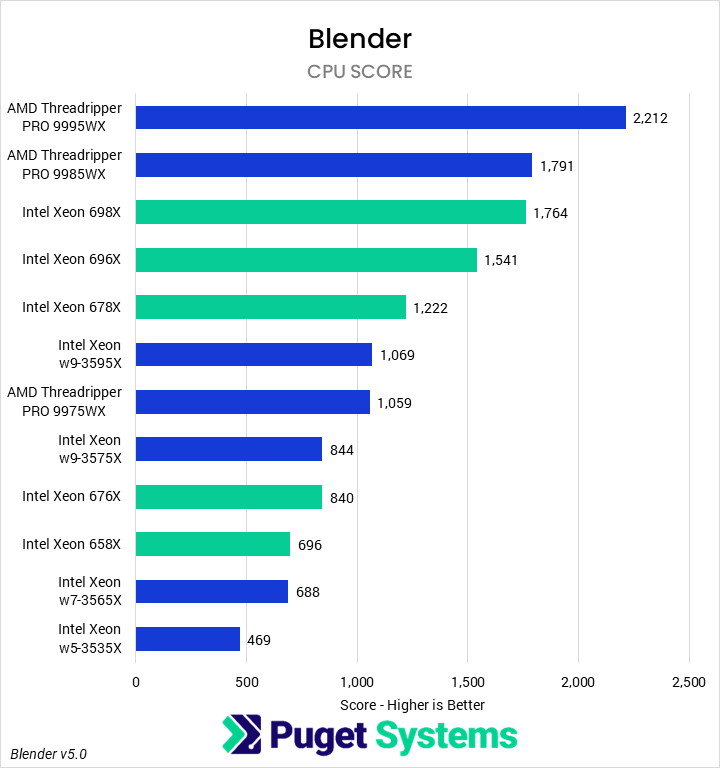
Chart 5: Bar chart of CPU score in Blender, higher is better. The AMD Threadripper PRO 9995WX leads at 2,212, about 25% ahead of the Intel Xeon 698X at 1,764. The 698X is within 2% of the Threadripper PRO 9985WX at 1,791.
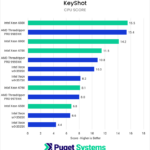
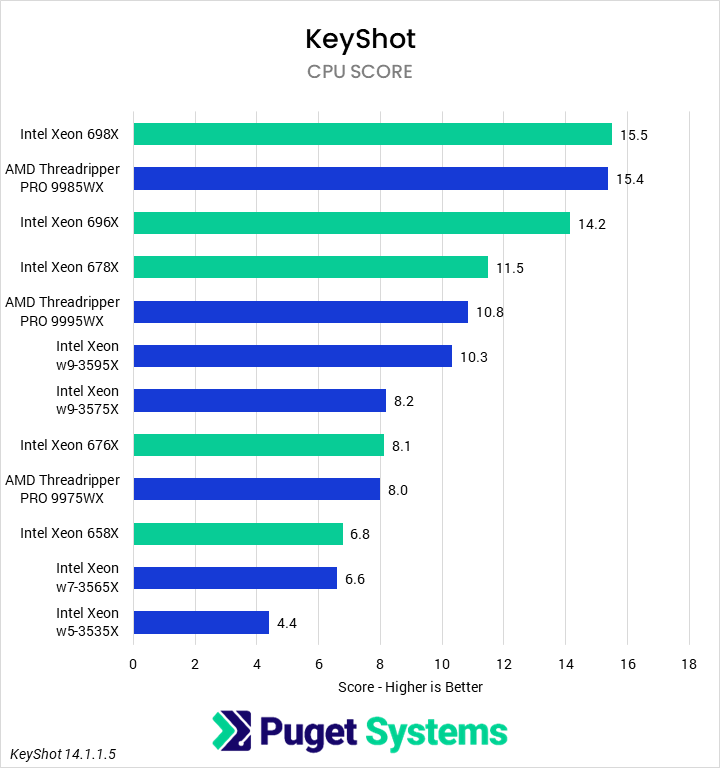
Chart 6: Bar chart of CPU score in KeyShot, higher is better. The Intel Xeon 698X leads at 15.5, essentially tied with the AMD Threadripper PRO 9985WX at 15.4, and about 50% ahead of the Xeon w9-3595X at 10.3.
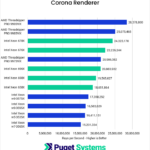
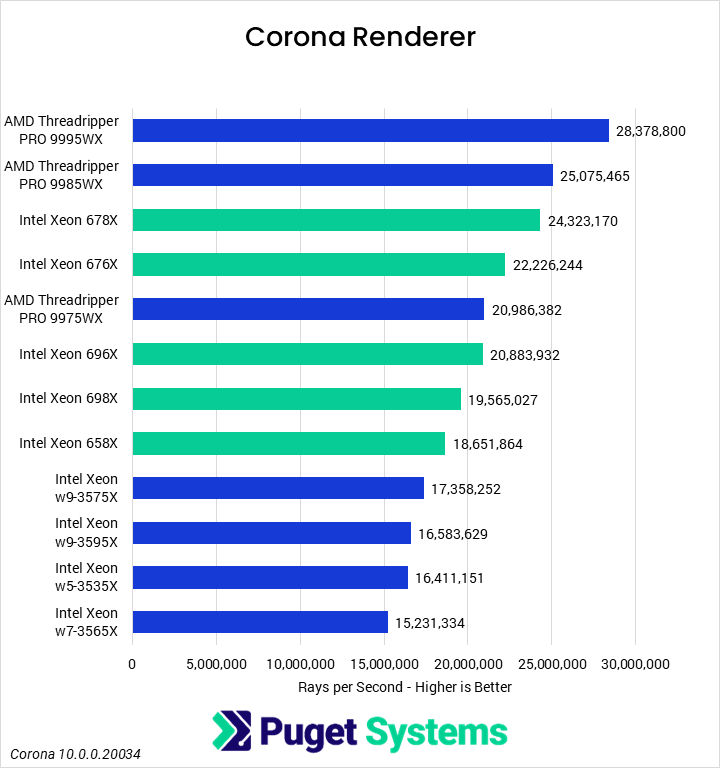
Chart 7: Bar chart of rays per second in Corona Renderer, higher is better. The AMD Threadripper PRO 9995WX leads at about 28.4 million. The fastest Intel Xeon 600 chip is the Xeon 678X at about 24.3 million, roughly 14% behind.
Chart 1: Bar chart of multi-threaded (N-thread) score in Cinebench 2026, higher is better. The AMD Threadripper PRO 9995WX leads at 23,674. The Intel Xeon 696X is about 4% behind at 22,734, ahead of the Threadripper PRO 9985WX and the Xeon 698X.
Chart 2: Bar chart of single-threaded score in Cinebench 2026, higher is better. The AMD Threadripper PRO 9995WX and 9985WX lead at 504 and 501. The Intel Xeon 600 chips score 373 to 411, led by the Xeon 678X at about 18% behind.
Chart 3: Bar chart of CPU mode score in V-Ray, higher is better. The AMD Threadripper PRO 9995WX leads at 143,899. The Intel Xeon 698X follows the 9985WX at 129,222, about 10% behind the 9995WX.
Chart 4: Bar chart of CUDA mode score running on the CPU in V-Ray, higher is better. The AMD Threadripper PRO 9995WX leads at 7,525. The Intel Xeon 698X is the fastest Xeon 600 chip at 5,884, about 22% behind and 5% behind the 9985WX.
Chart 5: Bar chart of CPU score in Blender, higher is better. The AMD Threadripper PRO 9995WX leads at 2,212, about 25% ahead of the Intel Xeon 698X at 1,764. The 698X is within 2% of the Threadripper PRO 9985WX at 1,791.
Chart 6: Bar chart of CPU score in KeyShot, higher is better. The Intel Xeon 698X leads at 15.5, essentially tied with the AMD Threadripper PRO 9985WX at 15.4, and about 50% ahead of the Xeon w9-3595X at 10.3.
Chart 7: Bar chart of rays per second in Corona Renderer, higher is better. The AMD Threadripper PRO 9995WX leads at about 28.4 million. The fastest Intel Xeon 600 chip is the Xeon 678X at about 24.3 million, roughly 14% behind.
Previous Next
System Image
Chart 1: Bar chart of multi-threaded (N-thread) score in Cinebench 2026, higher is better. The AMD Threadripper PRO 9995WX leads at 23,674. The Intel Xeon 696X is about 4% behind at 22,734, ahead of the Threadripper PRO 9985WX and the Xeon 698X.
Open Full Resolution
Chart 2: Bar chart of single-threaded score in Cinebench 2026, higher is better. The AMD Threadripper PRO 9995WX and 9985WX lead at 504 and 501. The Intel Xeon 600 chips score 373 to 411, led by the Xeon 678X at about 18% behind.
Open Full Resolution
Chart 3: Bar chart of CPU mode score in V-Ray, higher is better. The AMD Threadripper PRO 9995WX leads at 143,899. The Intel Xeon 698X follows the 9985WX at 129,222, about 10% behind the 9995WX.
Open Full Resolution
Chart 4: Bar chart of CUDA mode score running on the CPU in V-Ray, higher is better. The AMD Threadripper PRO 9995WX leads at 7,525. The Intel Xeon 698X is the fastest Xeon 600 chip at 5,884, about 22% behind and 5% behind the 9985WX.
Open Full Resolution
Chart 5: Bar chart of CPU score in Blender, higher is better. The AMD Threadripper PRO 9995WX leads at 2,212, about 25% ahead of the Intel Xeon 698X at 1,764. The 698X is within 2% of the Threadripper PRO 9985WX at 1,791.
Open Full Resolution
Chart 6: Bar chart of CPU score in KeyShot, higher is better. The Intel Xeon 698X leads at 15.5, essentially tied with the AMD Threadripper PRO 9985WX at 15.4, and about 50% ahead of the Xeon w9-3595X at 10.3.
Open Full Resolution
Chart 7: Bar chart of rays per second in Corona Renderer, higher is better. The AMD Threadripper PRO 9995WX leads at about 28.4 million. The fastest Intel Xeon 600 chip is the Xeon 678X at about 24.3 million, roughly 14% behind.
Open Full Resolution
Previous Next

The first renderer we looked at was Cinebench 2026 and, in particular, the multi-threaded score (Chart #1). This benchmark scales very well with cores up to about 64, at which point further gains are marginal at best. We found that the new Intel Xeon 600 processors were very competitive with AMD’s Threadripper PRO models, and saw great generational improvements over Xeon W-3500 (about 40% on average). The 696X was particularly impressive, matching the 9985WX and falling just slightly behind the 9995WX. In contrast, though still offering good performance, Intel’s 698X failed to distinguish itself, performing slightly worse than the 696X. The 9975WX has two interesting comparators, with the 676X matching it for cores and the 678X matching it for price; the former was 7% slower while the latter was 31% faster.

Single-core performance in Cinebench (Chart #2) is fairly meaningless as far as actual rendering goes, but the Intel processors saw about 10% gen-on-gen performance improvements while still falling well behind AMD’s Threadripper parts.

Although we test with two different modes in V-Ray, the results were basically identical between them, so we will only examine the traditional CPU mode performance (Chart #3). As has historically been the case, AMD takes the top spots in V-Ray, though Intel has managed to really close the gap. The 698X was only 11% slower than the 9995WX and 6% slower than the 9985WX, which, while not enough to justify its price, is a good sign for the rest of the family. The 696X falls behind the 9985WX in per-core performance by 17%, but it is also 40% cheaper. In fact, the 678X highlights this price-to-performance disparity, coming in cheaper than the 9975WX, but beating it (and the top-end last-gen 3595X) by 10%. On average, generational improvements here are about 40%.

Blender (Chart #5) paints a similar picture to V-Ray, with AMD’s 64- and 96-core parts leading the chart, but the top three Intel parts following them. Core for core, AMD is better, and it offers the best overall performance, but Intel is very competitive on cost for a given level of performance. Generational gains here are about 44%, except the 676X, which only managed about 22%.

In the KeyShot benchmark (Chart #6), we saw the first–and only–instance of Intel’s Xeon 600 processors topping the chart. The 698X had the highest score, beating the 9985WX by 1%, which was, in turn, only about 9% faster than the 696X. Oddly, we found the 9995WX to perform rather poorly in this benchmark, as it trailed even the 678X. At 32 cores, the 676X managed to beat out the 9975WX by 1%. Generationally, we saw performance improvements of 10-20%, depending on whether additional cores were added.

The final renderer we tested with was Corona (chart #7). We once again found that AMD’s Threadripper processors offered the best available performance, but that the new Xeon 600 CPUs were highly competitive – though our results run-to-run were fairly noisy. The 678X was the fastest tested Intel CPU, coming in just 3% slower than the more-expensive 9985WX. The 676X followed it, beating the 9975WX by 6%. Oddly, the 64- and 86-core Intel parts did less well, with both of them scoring between the 9975WX and the 24-core 658X. We are unsure why this is the case. Nonetheless, generational gains were great, with most parts seeing around 40% improvement from their respective Xeon W-3500 parts.

HPC: Linpack

As an additional test for this review, we took the Intel MKL Linpack benchmark (albeit a slightly older version, as it is currently what we use for in-house testing) and ran it at 5 different problem sizes, ranging from 25000 to 45000. We then computed a geometric mean of the results for each CPU. Because this version of Linpack is compiled specifically for Intel CPUs, the AMD processors were excluded from testing.
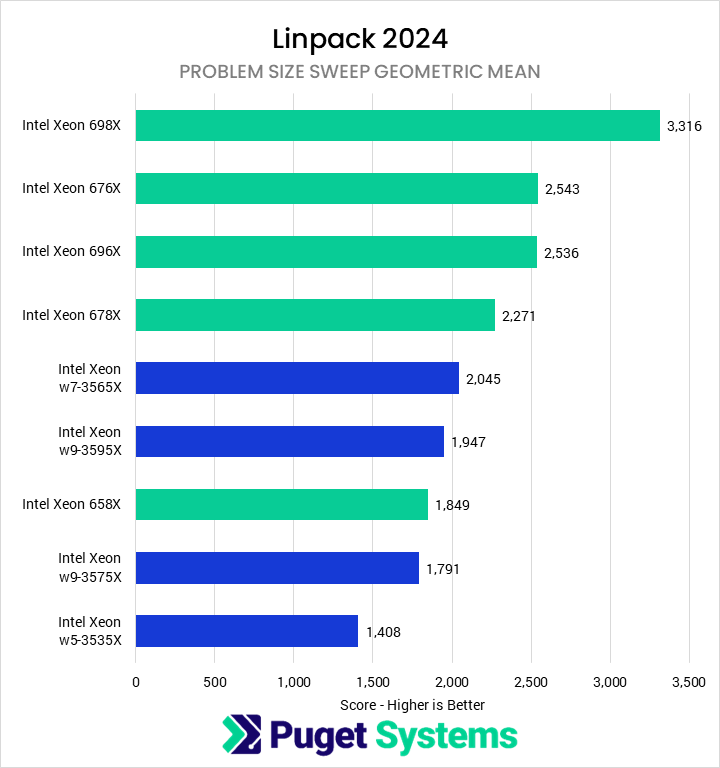
Bar chart of Linpack 2024 problem size sweep geometric mean score, higher is better. The Intel Xeon 698X leads at 3,316. That is about 30% ahead of the Xeon 676X and 696X at about 2,540, and 62% ahead of the fastest Xeon W-3500 chip.
Image
Open Full Resolution

The new Xeon 600 processors showed great generational improvements in this workload. Starting at the bottom of the stack, the 658X was 31% faster than the 3535X. At 32 cores, the 676X was 24% faster than the 3565X, though interestingly, both of these outperformed some higher core-count parts. Moving up to the 678X, it was 27% faster than the 3575X. Finally, the 696X beat the 3595X by 30%. There is no gen-on-gen comparison for the 698X, but it did top the chart with a 30% lead over the 696X and 676X.

Conclusion

Intel’s new Xeon 600 processors for Workstations present an interesting question: does one of the best generational leaps we’ve seen in years, often as high as 40% in heavily-threaded workloads, alongside an aggressive pricing strategy, manage to break the stranglehold that AMD has on the HEDT / workstation market? Although it does vary depending on the specific professional application we tested, unfortunately, the answer isn’t always clear.

In media and entertainment applications such as Photoshop, Premiere, After Effects, and DaVinci Resolve, the new Intel processors saw solid generational improvements over the Xeon W-3500 parts, often around 20-30%. In Photoshop and After Effects, AMD’s processors topped the charts, with the first few spots being dominated by their parts. Similarly, AMD had the fastest processor for Premiere and DaVinci Resolve, though in those applications, Intel managed to occupy the next few slots. However, the fastest Intel processor in all of these applications was always either the 676X or 658X, both of which are priced far below the 9975WX, let alone the 9985WX. That makes Intel a compelling option when looking for a good value processor, though we would caution that many of these applications tend to run even better on consumer-class hardware like an AMD Ryzen™ 9850X3D or Intel Core™ Ultra 270K Plus.

In our Unreal Engine testing, we saw great generational improvements for the Xeon processors, from 20% at the low end to 40% at the high end, with most of the CPUs falling into the latter bucket. However, even with their lower prices per core, Intel’s high core count Xeons are hard to justify for these use cases. AMD offers at least 10% better performance at the same price, resulting in good performance per dollar. For more “mid-range” workstations, Intel did offer far better value, with CPUs much cheaper than the 9975WX managing to match or outperform it.

Finally, in CPU-based renderers, we observed a similar trend. The average uplift, gen on gen, was 40% in many rendering engines. AMD nonetheless had the two fastest processors with the 9995WX and 9985WX, save for in KeyShot. While Intel managed to reduce the gap in performance by a large amount, it still was not quite able to do so at a price that made their top-end parts compelling for a high-end workstation. Compared to the 32-core 9975WX, though, Intel did have a winner, with the cheaper 678X often outperforming it by 10-30%.

Overall, we are very impressed with the combination of specifications, performance, and cost that Intel managed to achieve with this latest family of Xeon processors. Although it did not quite manage to take the performance crown from AMD, and particularly struggled more towards the top-end of the product stack, Intel did reintroduce real competition to a market segment long dominated by AMD — at least as long as you can find one of these processors to buy.


If you need a powerful workstation to tackle the applications we’ve tested, the Puget Systems workstations on our solutions page are tailored to excel in various software packages. If you prefer a more hands-on approach, our custom configuration page helps you configure a workstation that matches your needs. Otherwise, if you would like more guidance in configuring a workstation that aligns with your unique workflow, our knowledgeable technology consultants are here to lend their expertise.

Tower Computer Icon in Puget Systems Colors

Looking for a new desktop workstation?

We build computers tailor-made for your workflow. 

Configure a System
Talking Head Icon in Puget Systems Colors

Don’t know where to start?
We can help!

Get in touch with one of our technical consultants today.

Talk to an Expert

Related Content

  • Intel Xeon 600 Workstation Content Creation Review
  • Houdini Hardware Performance: CPU and GPU Benchmarks
  • AMD Ryzen 9 9950X3D2 Dual Edition Review
  • 7200 vs 5600 Mbps RAM For Core Ultra 200S Plus Processors
View All Related Content

Latest Content

  • Intel Xeon 600 Workstation Content Creation Review
  • Consultant’s Corner: Custom Testing
  • Houdini Hardware Performance: CPU and GPU Benchmarks
  • Updated Houdini Benchmark Testing Methodologies
View All

Who is Puget Systems?

Puget Systems builds custom workstations, servers and storage solutions tailored for your work.

We provide:

Extensive performance testing
making you more productive and giving better value for your money

Reliable computers
with fewer crashes means more time working & less time waiting

Support that understands
your complex workflows and can get you back up & running ASAP

A proven track record
as shown by our case studies and customer testimonials

Get Started

Browse Systems

Puget Systems Mobile Laptop Workstation Icon

Mobile

Puget Systems Tower Workstation Icon

Workstations

Puget Systems Rackmount Workstation Icon

Rackstations

Puget Systems Rackmount Server Icon

Servers

Puget Systems Rackmount Storage Icon

Storage

Latest Articles

  • Intel Xeon 600 Workstation Content Creation Review
  • Consultant’s Corner: Custom Testing
  • Houdini Hardware Performance: CPU and GPU Benchmarks
  • Updated Houdini Benchmark Testing Methodologies
  • State of ARM Support for Puget Bench
View All

Post navigation

 Houdini Hardware Performance: CPU and GPU Benchmarks
Puget Systems Logo in White and Green
Build Your Own PC Site Map FAQ
facebook instagram linkedin rss twitter youtube

Optimized Solutions

  • Adobe Premiere
  • Adobe Photoshop
  • Solidworks
  • Autodesk AutoCAD
  • AI & Machine Learning

Workstations

  • Media & Entertainment
  • Engineering
  • Scientific PCs
  • More

Support

  • Online Guides
  • Request Support
  • Remote Help

Publications

  • All News
  • Puget Blog
  • HPC Blog
  • Hardware Articles
  • Case Studies

Policies

  • Warranty & Return
  • Terms and Conditions
  • Privacy Policy
  • Delivery Times
  • Accessibility

About Us

  • Testimonials
  • Careers
  • About Us
  • Contact Us
  • Newsletter

© Copyright 2026 - Puget Systems, All Rights Reserved.

Dynamic title for modals

Are you sure?

Please confirm deletion. There is no undo!