Table of Contents
Introduction
At CES this year, AMD announced the Ryzen™ 7 9850X3D. Based on the popular Ryzen 7 9800X3D, it offers the same core count and cache while increasing the maximum frequency by 400 MHz to 5.6 GHz. Since its launch, the 9800X3D has been widely considered the world’s fastest gaming CPU, and we have found it to be highly performant in some content creation workflows. The increased frequency promises to further improve its capabilities, though professional workflows tend to be less sensitive to small frequency improvements than games — see, for example, the Intel Core™ i9 14900KS. Nonetheless, we are excited to see how the 9850X3D compares in professional content creation applications.
At this point in the lifecycle of Ryzen 9000, the basics of the 9850X3D likely need no introduction. It is based on AMD’s highly performant Zen 5 microarchitecture and features AMD’s second-generation 3D V-Cache. The CPU is composed of 2 chiplets: one I/O die and one CCD (core complex die) containing eight Zen 5 cores. On the “bottom” of the CCD is an additional 64 MB cache die, increasing the Level 3 cache available to the cores to 96 MB.
The 9850X3D is, ultimately, just a well-binned version of the 9800X3D. While operating at the same voltages and TDP, AMD achieved an 8% higher maximum boost clock. As shown by the Intel CPU we referenced above, this isn’t unusual to manage over the lifespan of a product. Manufacturers can often aggressively bin silicon as it is produced, and maturing process nodes allow for better silicon on average.
This means that the 9850X3D is drop-in-replaceable with any other Ryzen 7000 or Ryzen 9000 processor. Upgrades in place are fine, though AMD recommends upgrading to the latest Windows, BIOS, chipset driver, and Radeon driver versions for best support and performance. With these, AMD claims to have addressed some of the scheduling issues that could cause lower performance on multi-CCD X3D processors when changing from a single to a dual-CCD processor.
As we primarily focus on professional use cases, we won’t be including any data on the 9850X3D’s primary purpose: gaming. However, we encourage readers interested in gaming performance to check out Hardware Unboxed’s review (Video), Gamer’s Nexus’ review (Video), or de8auer’s review (Video). igor’sLAB and StorageReview also have good written reviews examining other workflows, such as engineering and simulation.
Specifications
Based on the introduction, this isn’t the most exciting launch. The 9850X3D is nearly identical to the 9800X3D, with the only differences being price and maximum frequency. However, the price increase is modest — especially when viewed as part of a whole system purchase — and thus may be worth it for anyone considering a 9800X3D. On that topic, the numbers listed above are the current manufacturer retail prices, which are often a bit above market rates (sometimes by as much as $10-40). If you go to a retailer, you may be able to pick up any of these CPUs for a bit less than listed, though the relative ordering is essentially the same. This means the 9850X3D may in practice only be about $20-30 more than the 9800X3D.
The relative prices of AMD’s Ryzen processors do raise one concern, though it has been the case for the other X3D parts since their launch: is the 3D V-Cache worth it in content creation? In the past, the answer has largely been “no”, with a few exceptions. With the 9850X3D priced at $500, and the 9950X at $550 – though again, often available for a bit less – that means a relatively small budget increase could result in twice the cores.
Test Setup
AMD Ryzen Test Platform
| CPUs: AMD Ryzen™ 7 9850X3D AMD Ryzen™ 9 9950X3D AMD Ryzen™ 7 9800X3D AMD Ryzen™ 7 9700X |
| CPU Cooler: Noctua NH-U12A |
| Motherboard: ASUS ProArt X670E-Creator WiFi BIOS Version: 3402 |
| RAM: 2x DDR5-5600 32GB (64 GB total) |
| GPUs: NVIDIA GeForce RTX™ 5080 Driver Version: 591.74 |
| PSU: EVGA SuperNOVA 1200W P2 |
| Storage: Kingston KC3000 2TB |
| OS: Windows 11 Pro 64-bit (26200) Power Profile: Balanced |
Intel Core Ultra Test Platform
| CPUs: Intel Core™ Ultra 9 285K |
| CPU Cooler: Noctua NH-U12A |
| Motherboard: ASUS ProArt Z890-Creator WiFi BIOS version: 2302 |
| RAM: 2x DDR5-6400 CUDIMM 32GB (64 GB total) |
| GPUs: NVIDIA GeForce RTX™ 5080 Driver Version: 591.74 |
| PSU: Super Flower LEADEX Platinum 1600W |
| Storage: Samsung 980 Pro 2TB |
| OS: Windows 11 Pro 64-bit (26200) Power Profile: Balanced |
Benchmark Software
| Photoshop 27.2 — Puget Bench for Photoshop 1.0.5 |
| Premiere Pro 25.6 — PugetBench for Premiere Pro 2.0.8 |
| After Effects 25.6 — Puget Bench for After Effects 1.1 |
| DaVinci Resolve 20.3 — Puget Bench for DaVinci Resolve 2.0.8 |
| Unreal Engine 5.5 & 5.7 |
| Visual Studio 2022 |
| Unigine Superposition 1.0 |
| Cinebench 2026 |
| V-Ray 6.00.01 |
| Blender 4.5 |
| MLPerf Client v1.0 |
| Llama.cpp 5122 |
We followed our standard methodology for this review, with Intel and AMD-based platforms featuring ASUS ProArt motherboards and NVIDIA GeForce RTX™ 5080 GPUs. Windows, BIOSes, and drivers were all up to date as of the start of the testing. In line with our focus on professional workflows, we kept the processors running stock: overclocking features such as ASUS MCE and MLB were disabled, as was AMD’s PBO, and the 285K was run with the default “Performance” power plan. RAM was locked to the maximum CPU-supported frequency at JEDEC timings, so 5600 for AMD and 6400 for Intel. Additionally, we left Windows security settings like VBS in their default (enabled) state.
To cover a wide range of possible workflows, we tested with nearly every content creation-focused benchmark we have access to. This includes most of the Puget Bench for Creators suite (including some upcoming 2.0 versions), three offline CPU-based renderers, our in-development Unreal Engine benchmarks (both in-engine and engine compilation), and a smattering of AI benchmarks. As the 9850X3D is touted as the world’s fastest gaming CPU, we also included two real-time renderers to see if there was any impact on in-engine rendering performance for artists.
Graphic Design: Adobe Photoshop
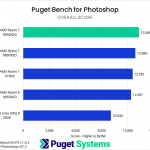
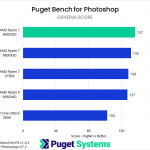
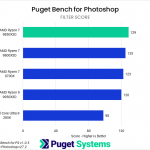
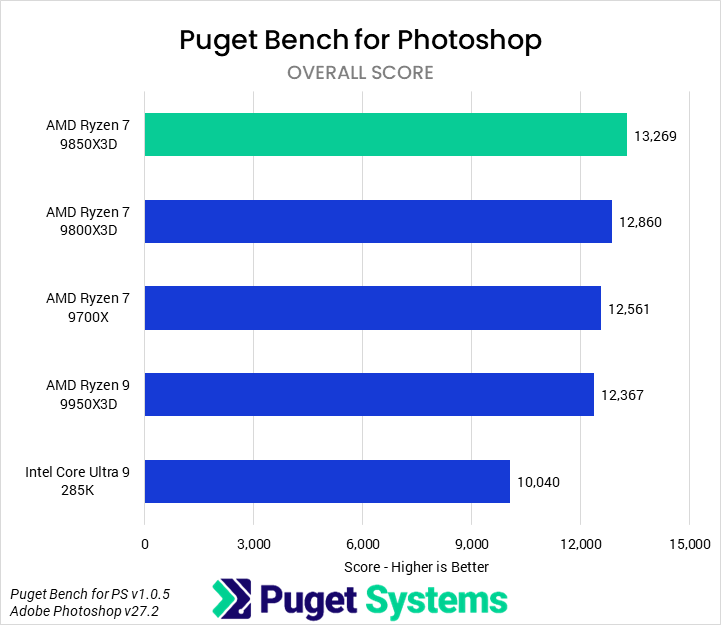
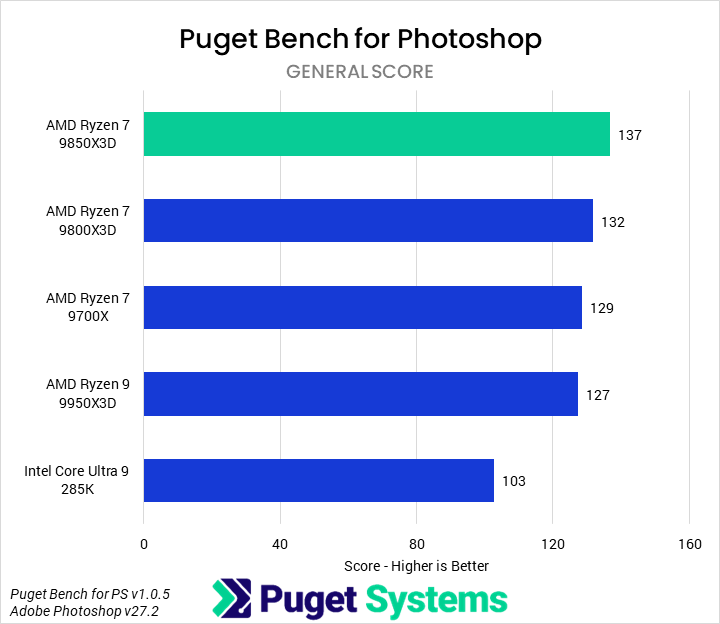
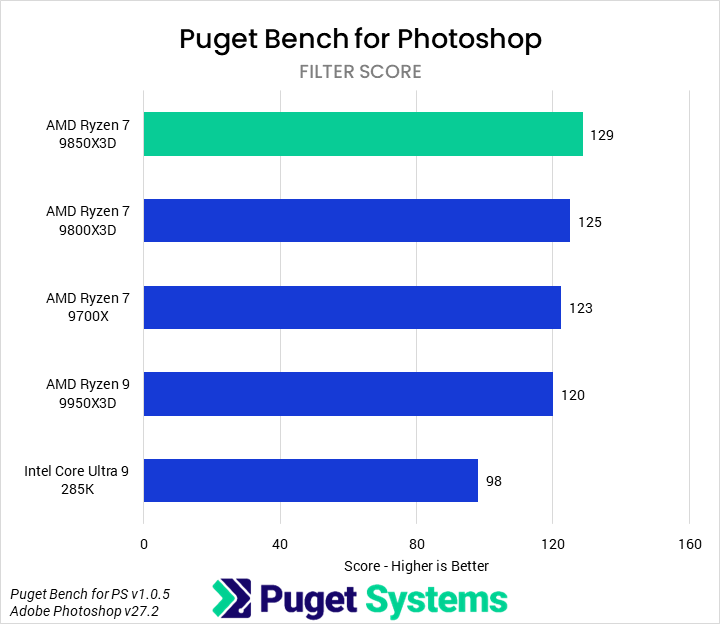
The first application we benchmarked was Adobe Photoshop using our own Puget Bench for Photoshop, where we measure three primary scores: Overall, which captures the entirety of the performance; General, which looks at typical tasks like importing, saving, resizing, and masking; and Filter, which examines the performance of a variety of filter tools. Photoshop is historically dependent on single-core performance.
Starting with the Overall score, the 9850X3D performs very well, leading the chart with a 3% performance advantage over the 9800X3D. It is also 7% faster than the 9950X3D. AMD’s Ryzen 9000 processors are very performant in Photoshop, and all of them lead the Intel 285K, with the 9850X3D scoring 32% higher.
As the subscores show nearly identical trends and performance ratios, we aren’t going to dig any deeper into them. While a 3% performance increase for a 6% cost increase isn’t stellar, the 9850X3D is the fastest processor we have tested in Photoshop.
Video Editing: Adobe Premiere Pro
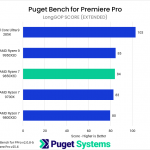
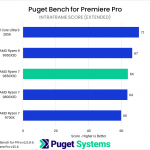
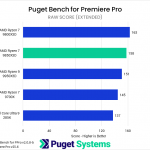
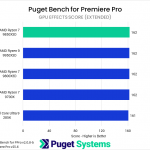
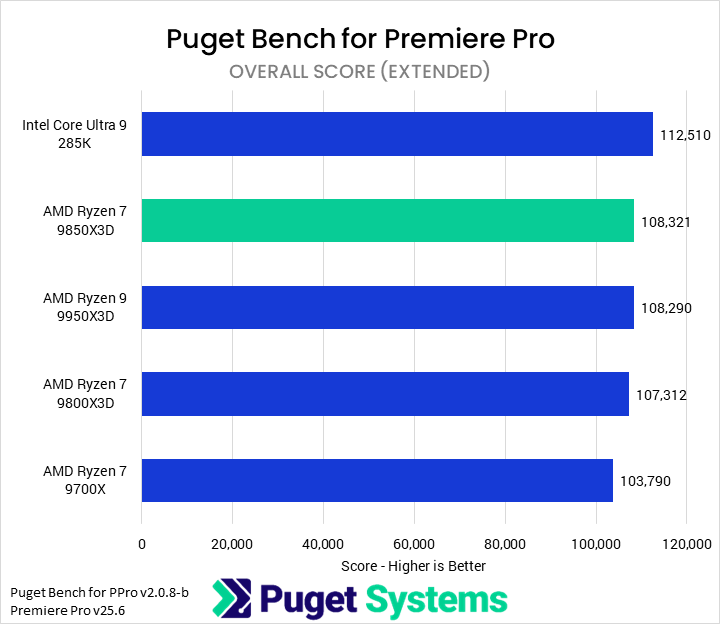
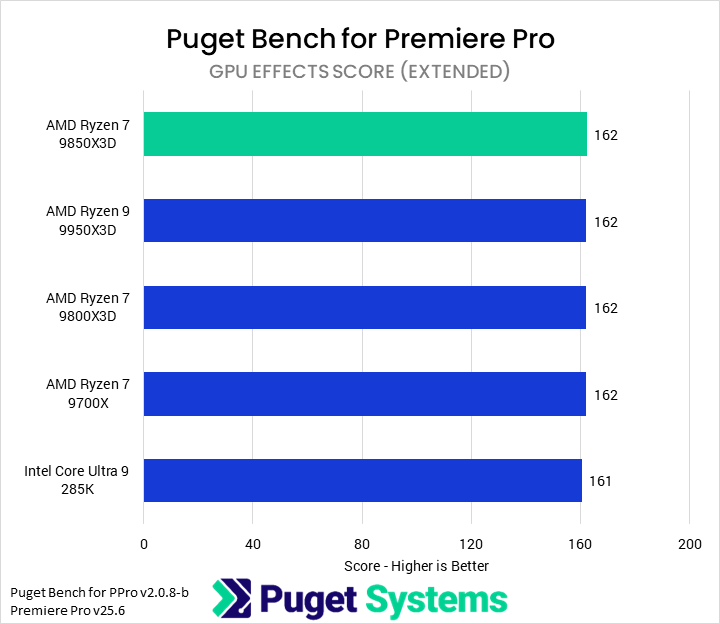
Next up is Premiere Pro. We’re taking a beta look at the upcoming version 2.0 of Puget Bench, so scores will look different from past articles. The subscores are still the same, though, including three codec-specific tests (LongGOP/Interframe, Intraframe, and RAW) and a GPU effects score.
The overall score showed very little difference between most of the CPUs. The Intel 285K led by 4%; the 9850X3D, 9950X3D, and 9800X3D all performed identically (within 1% of each other); and the 9700X trailed by about 3%. There’s not too much going on here, so we’ll move on to the subscores.
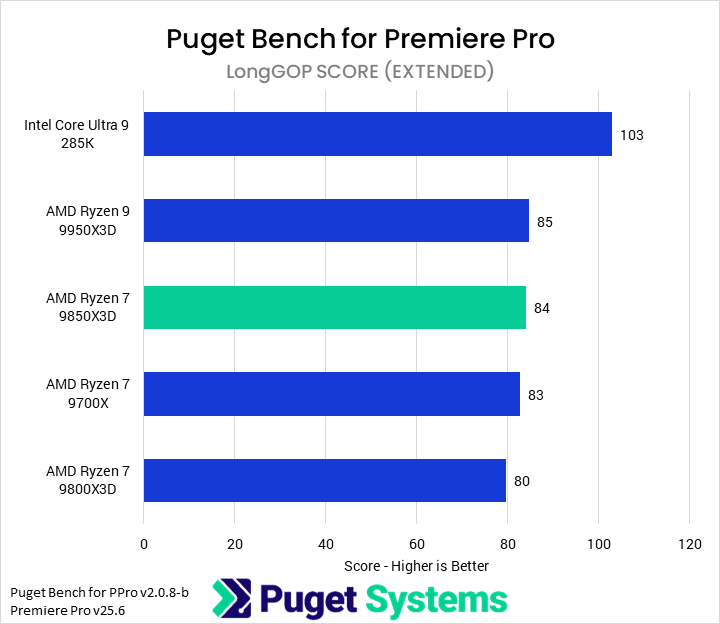
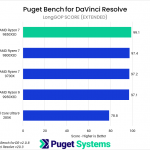
In our LongGOP subscore (Chart #2), we saw the most interesting result from Premiere Pro, although it didn’t have anything to do with the 9850X3D. Intel’s integrated GPU provided big performance improvements over the 5080’s media engine in LongGOP codecs, allowing the 285K to outperform the AMD processors by 22%. There was no real differentiation between AMD CPUs here, so the 9850X3D isn’t worth the additional cost over either the 9800X3D or even the 9700X.
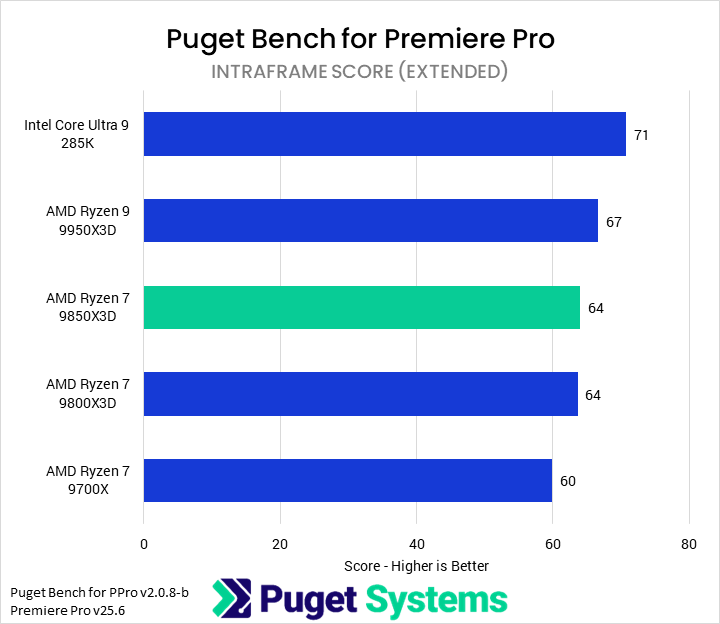
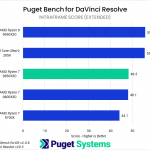
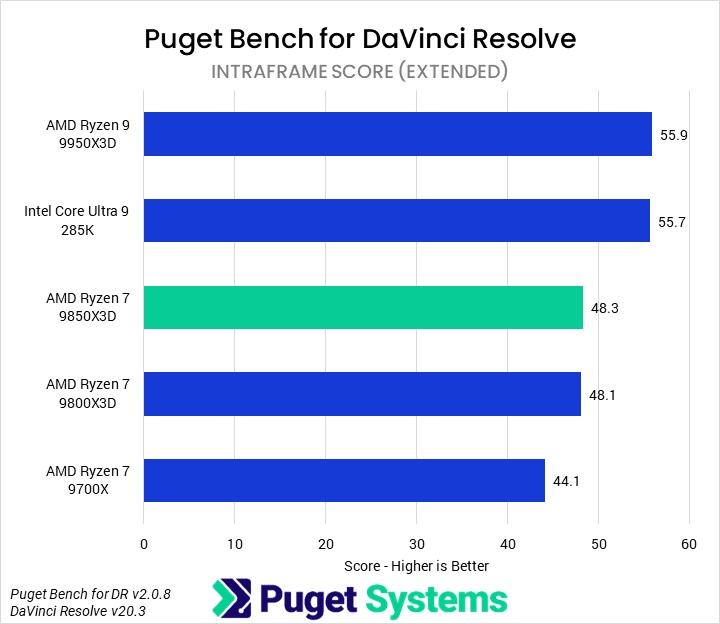
Intraframe codecs (Chart #3) are unaccelerated and so depend only on CPU performance. The 9850X3D scored identically to the 9800X3D in our testing, so it is not worth the additional cost in these workloads.
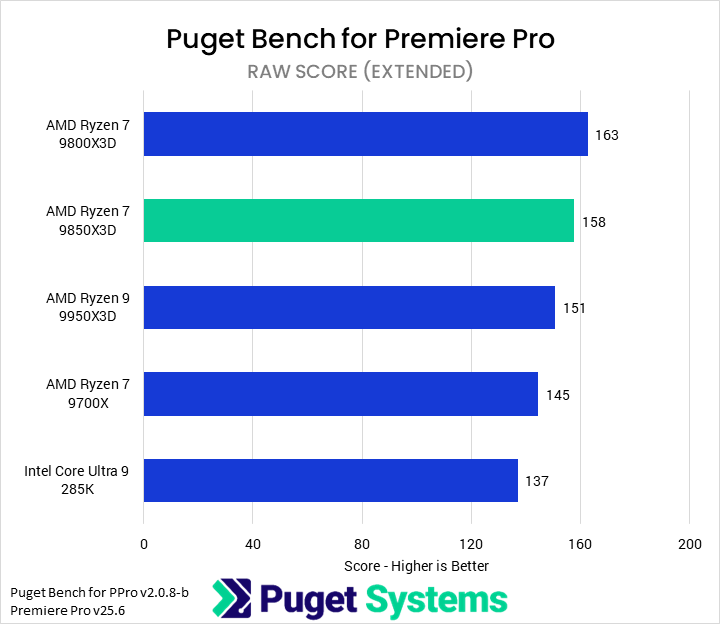
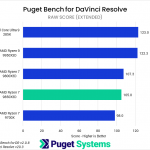
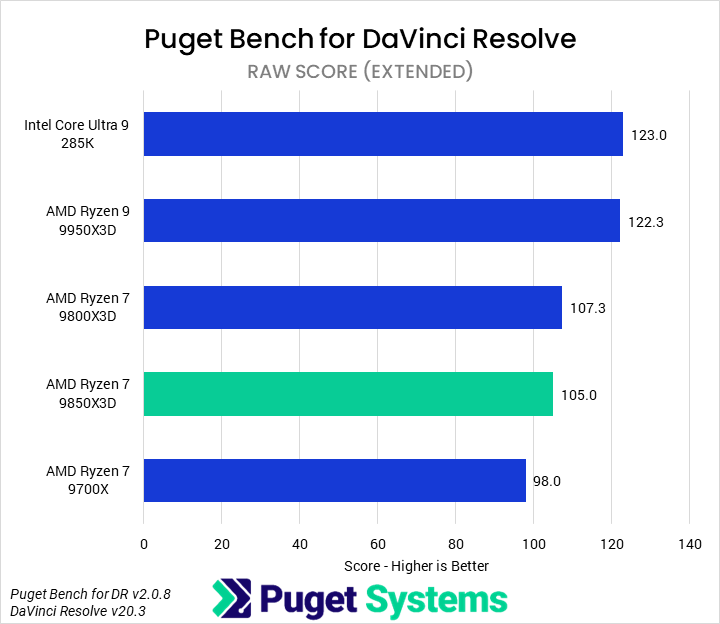
Finally, in our RAW tests, we found that the 9850X3D was the second fastest CPU, just trailing the 9800X3D. However, when investigating the individual tests that compose that score, we found that the 9850X3D (and 285K) each performed anomalously slow on a specific subtest. Based on that, we feel fairly confident that the 9850X3D is at least as performant as the 9800X3D. Either way, the 9850X3D performed well, with a 5% lead over the 9950X3D.
Based on this testing, we think that the 9850X3D is a competent CPU for Premiere Pro, though likely not worth the price increase over a 9800X3D unless there are other applications in a workflow that benefit from it.
Motion Graphics: Adobe After Effects
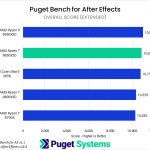
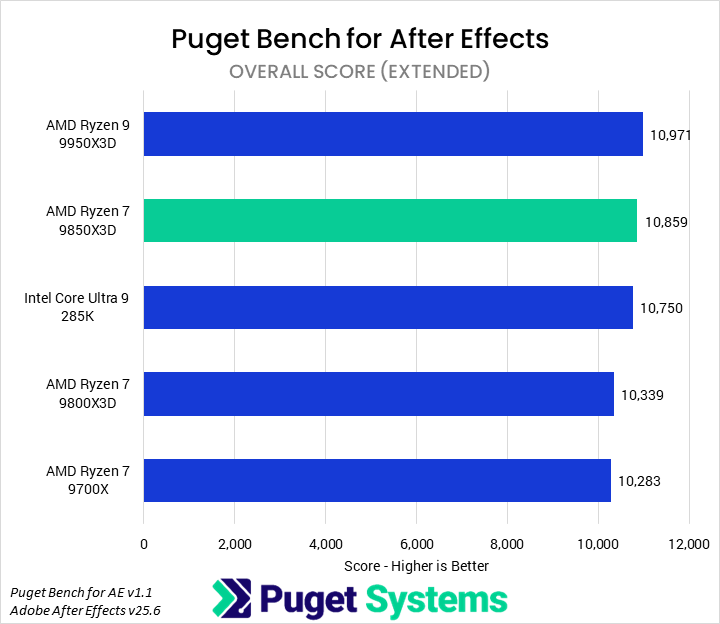
Adobe After Effects is a popular motion graphics, compositing, and visual effects application that has dramatically changed its hardware requirements over the last few years. Historically dependent primarily on single-threaded performance, it now can make use of a wide variety of GPU acceleration and multi-core processors. Supplementing the overall score, our After Effects benchmark splits out three subscores looking at traditional 2D workflows, emerging 3D workflows, and tracking tasks.
Starting with the Overall score, we found that the 9850X3D placed right between the 9950X3D and 285K, though all three scored within 1% of each other (well within the margin of error). However, that does mean it was 5% faster than the 9800X3D and 6% faster than the 9700X.
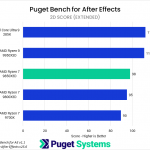
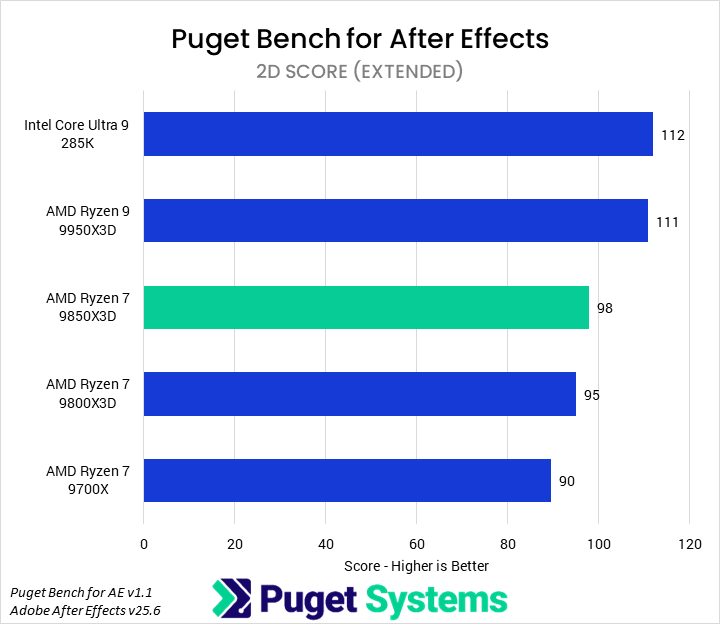
Moving on to the subscores, we can actually group them in terms of 9850X3D performance. We found that the 2D score (Chart #2) scaled primarily with the number of cores, and so the 9850X3D was only marginally faster than the 9800X3D (3%), although it managed a better lead over the 9700X (9%). These were fine improvements, but they mean that it was 12% slower than the 9950X3D and 285K.
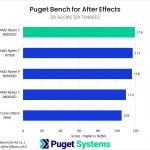
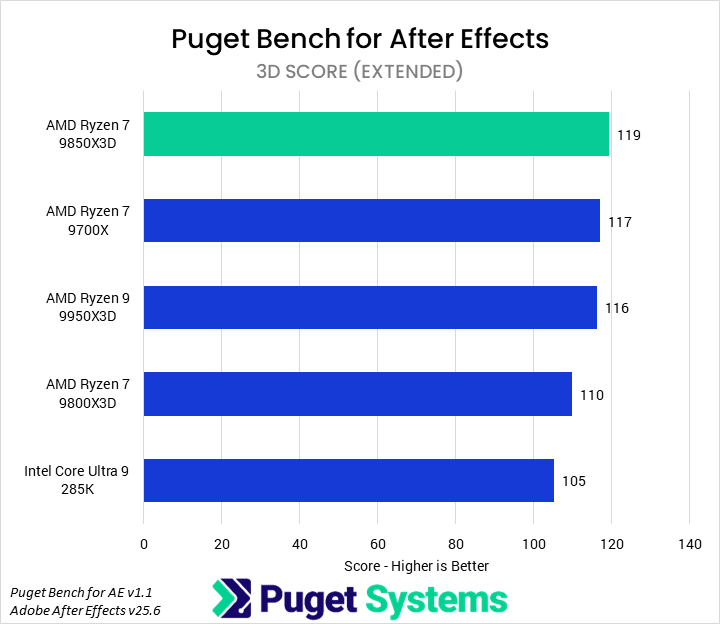
In the 3D (Chart #3) and Tracking (Chart #4) tests, the 9850X3D was the fastest CPU by 2% and 5%, respectively. While not huge performance advantages, they track the relative cost of the CPU to the 9800X3D closely enough. The flip side of that, though, is that the 9800X3D is slower than the 9700X in these tests.
Video Editing/Motion Graphics: DaVinci Resolve Studio
DaVinci Resolve is possibly the most complex application we regularly test, encompassing traditional video editing features, motion graphics capabilities with Fusion, and a robust set of AI tools. This also means it leverages hardware in a wide variety of ways, depending on the specific workflow.
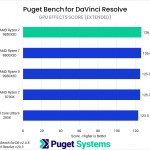
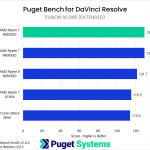
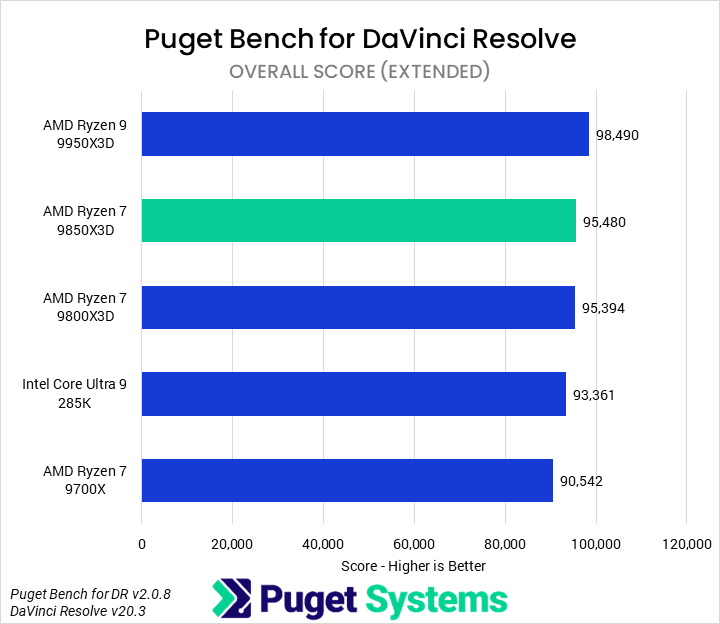
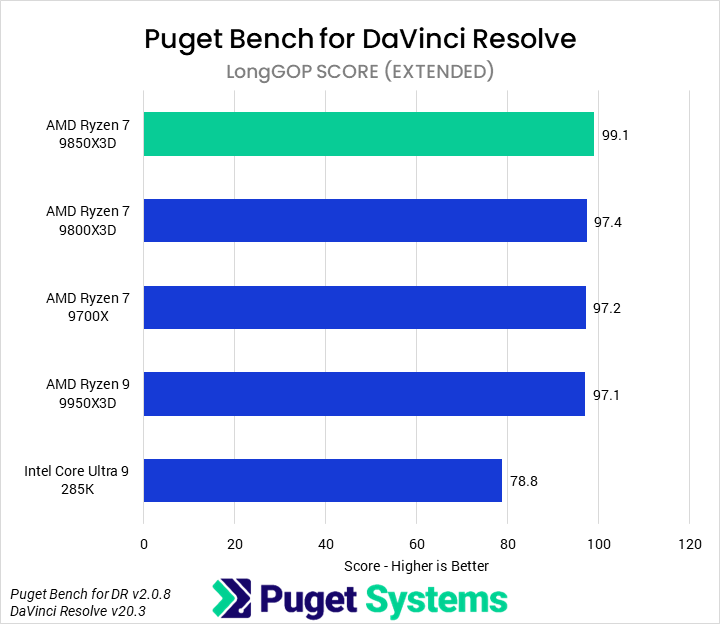
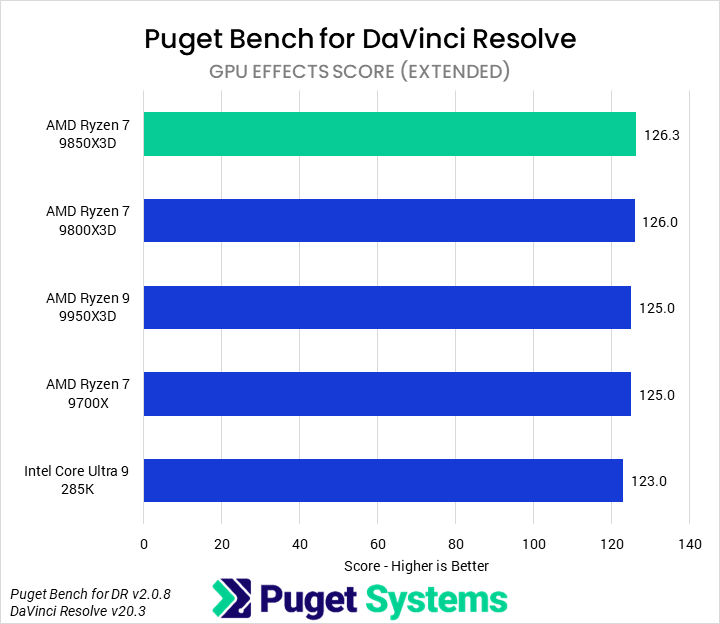
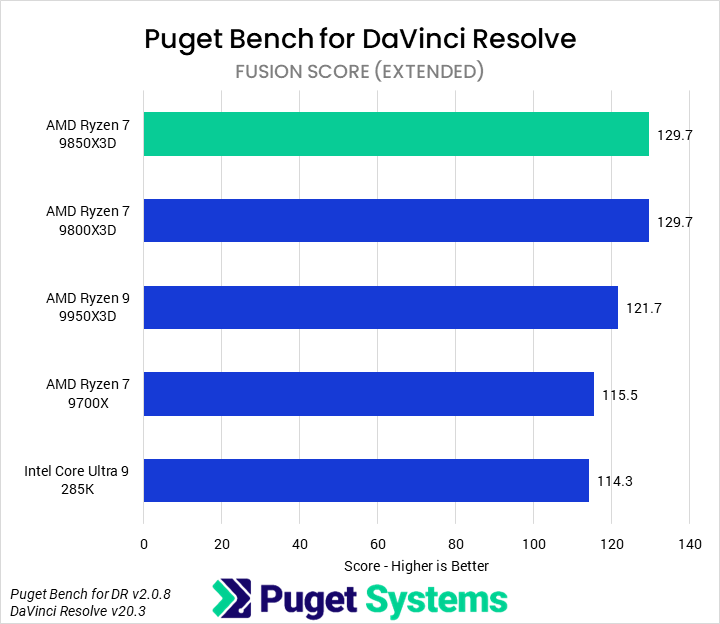
With that caveat in mind, the first result we looked at was the overall score (Chart #1). We found that the 9850X3D was sandwiched between the 9950X3D (3% ahead) and the 9800X3D (1% behind). Unfortunately for AMD, DaVinci Resolve failed to exploit the 9850X3D’s higher frequency over the 9800X3D across any of the subscores, with the two CPUs always within 1% of each other. This means that, although the 9850X3D was nominally the fastest CPU tested for the LongGOP, GPU Effects, and Fusion tests, a 9800X3D would be a strictly better value.
The 9850X3D is not a bad CPU for DaVinci Resolve — it offers chart-leading performance in less-threaded portions of the application — but it fails to compete with the rest of AMD’s great product line. Our recommendation would be to pick up a 9800X3D or 9900X within the same price range unless planning for mixed workflows with other applications that see more benefit.
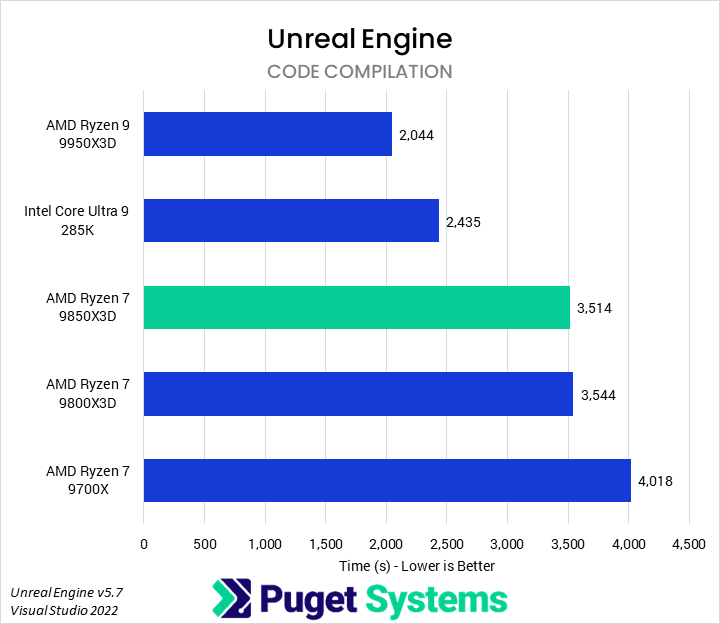
Game Dev/Coding: Unreal Engine & Visual Studio
System Image
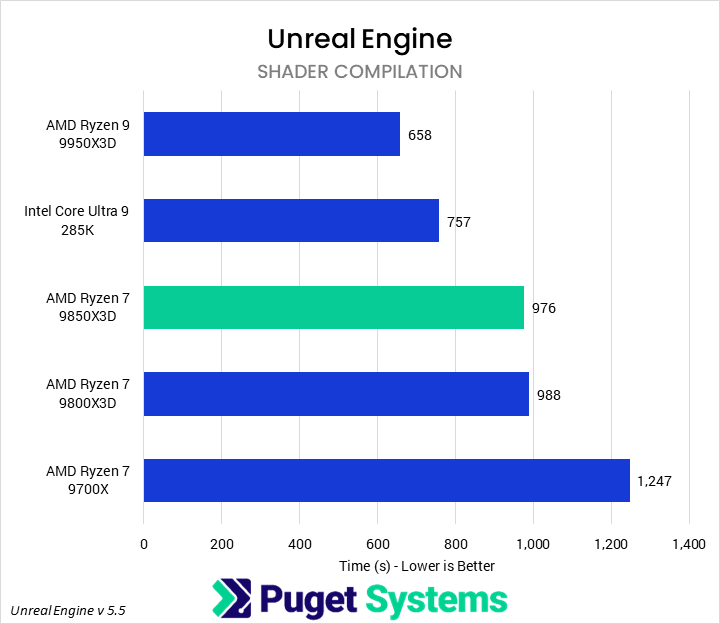
One area where we have seen significant improvements from 3D V-Cache in the past is shader compilation in Unreal Engine and code compilation in Visual Studio. These are both part of our internal Unreal Engine benchmark suite (alongside light baking, which we did not include in this article). In the past, we have found that they tend to scale well with cores, cache, and memory bandwidth.
Starting with shader compilation (Chart #1), the 9850X3D led the pack of Ryzen 7 processors, with a small 2% lead over the 9800X3D and 22% performance advantage over the 9700X. Unfortunately, this performance uplift was insufficient to close the gap between the 9850X3D and Intel 285K or, based on our past testing, the 9900X and 265K. Margins in code compilation were nearly identical.
The 9850X3D is still a performant CPU for these sorts of tasks, but the additional V-Cache cannot offset the sheer disparity in core count compared to similarly-priced processors. A higher-core-count processor will make sense for individuals who perform these tasks frequently, while small teams should look to larger HEDT-based build servers.
Game Dev (Rendering): Unreal Engine & Unigine
As mentioned in the test setup section, we don’t normally test real-time renderers in CPU reviews, as their performance depends almost wholly on the GPU. Nonetheless, they are an important part of some game development artists’ workflow, and AMD has touted the 9850X3D as the world’s best gaming CPU. So, we decided to include both Unreal Engine and Unigine to see if there was any impact due to the CPU used or whether we should expect the benefits of X3D processors to come only from their interactions with the rest of a game’s pipeline.
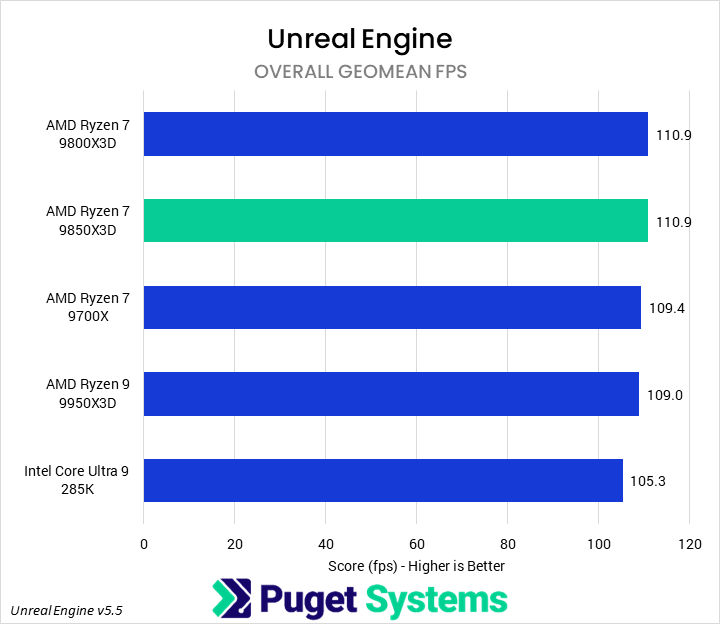
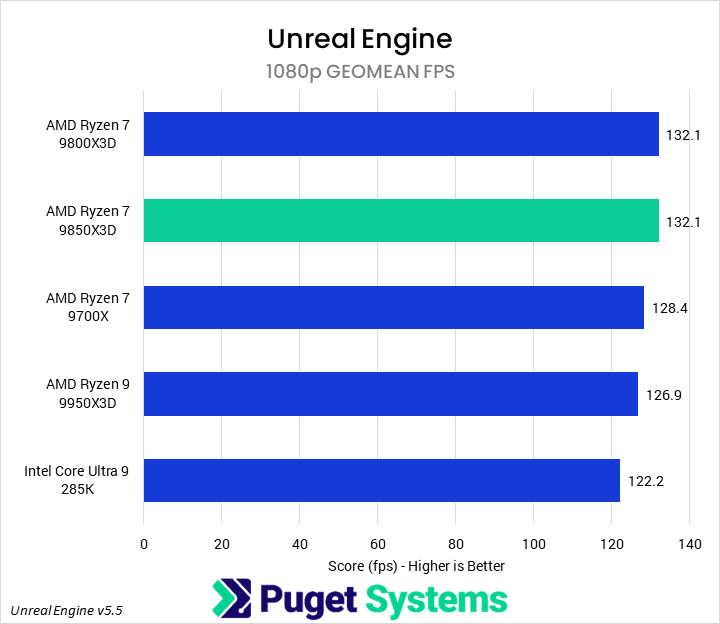
In Unreal Engine (Chart #1), we found no impact on performance from the CPU as long as we remained within the Ryzen family, though all of those slightly outperformed the 285K. Just in case we were too GPU-bound, we also pulled out the 1080p numbers (Chart #2), and did see some differentiation, with the 9800X3D and 9850X3D scoring 3% and 4% higher than the 9700X and 9950X, respectively. Still, we feel safe concluding that there is no real difference for in-engine rendering between these processors.
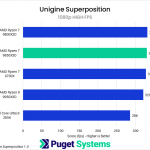
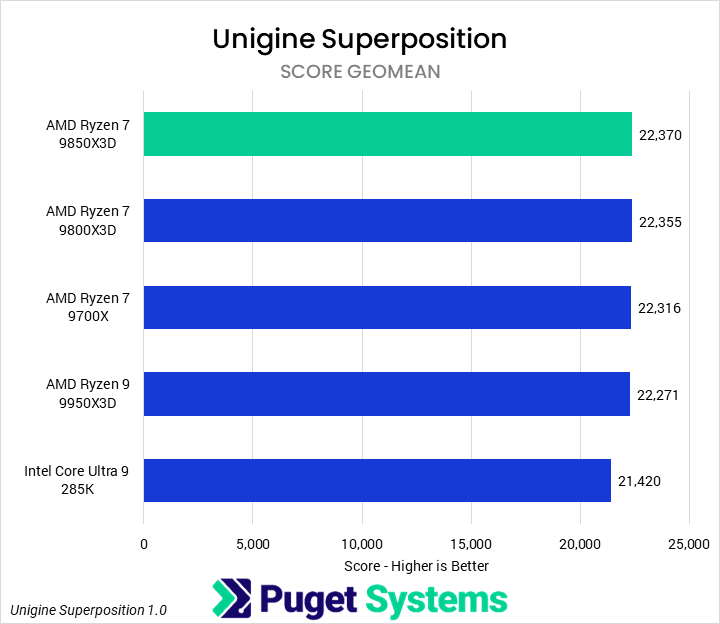
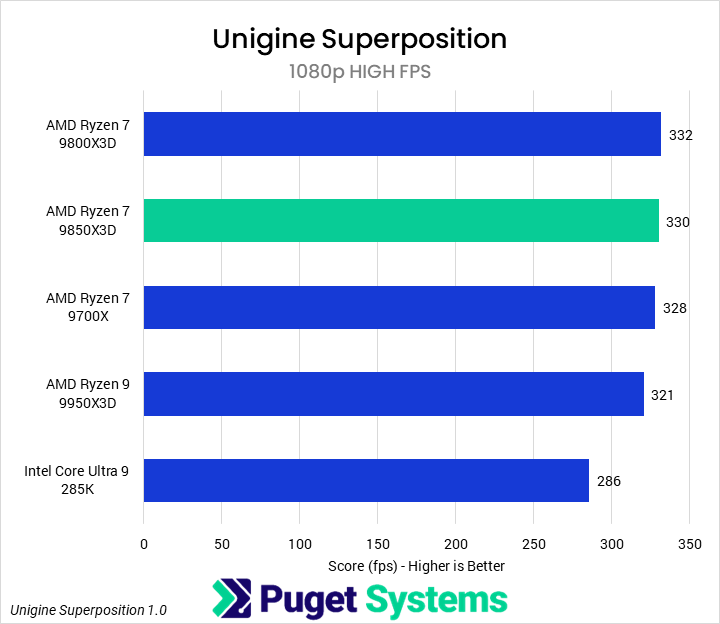
Unigine was effectively the same, with the GPU acting as the primary bottleneck, even at 1080p High. For professionals, this is fine. While high FPS is great for gamers, it is far less significant for helping developers do their work than decent speed in-engine and great performance on their blocker tasks.
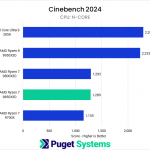
CPU Rendering: Cinebench, V-Ray, and Blender
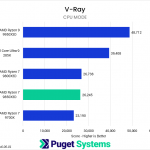
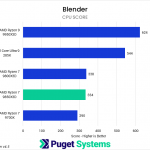
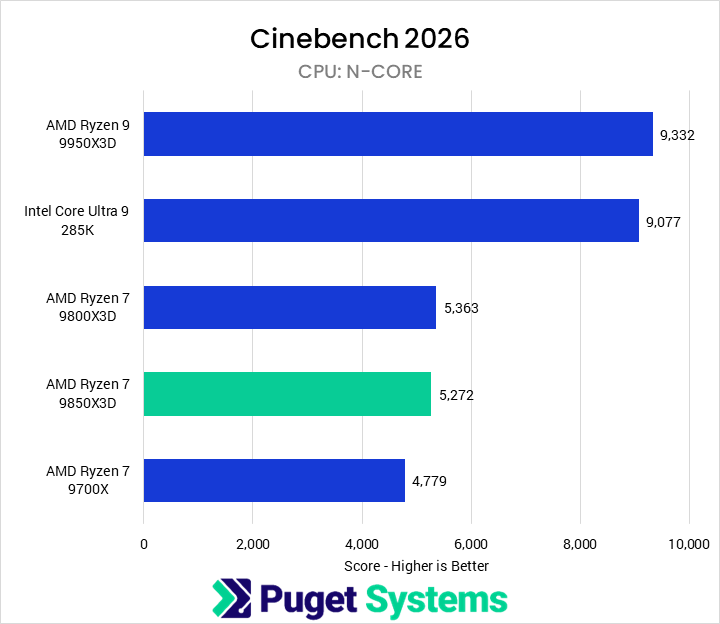
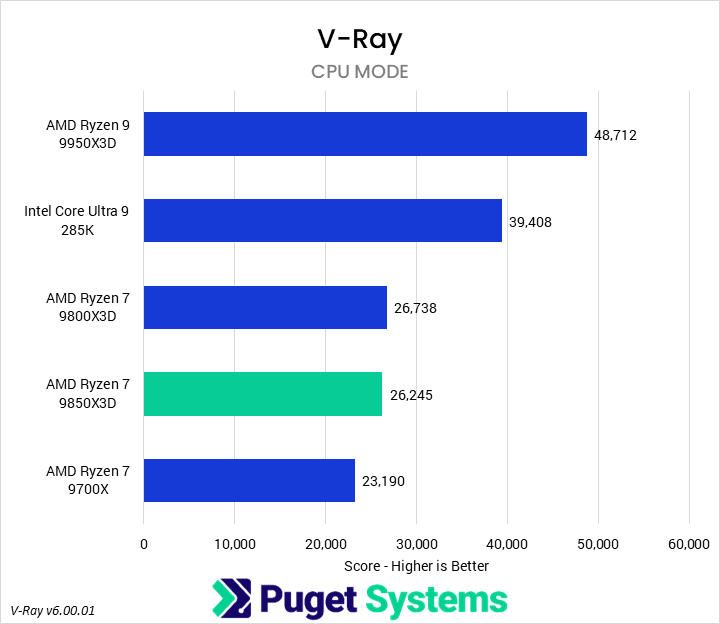
As is tradition, we tested with a variety of offline CPU-based renderers, including both the new Cinebench 2026 and older Cinebench 2024 (though we will not be directly covering the latter’s results). Low-core-count CPUs like the 9850X3D aren’t typically recommended for pure CPU rendering, but the results are consistent and can serve as good analogues for other workflows.
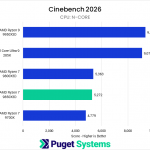
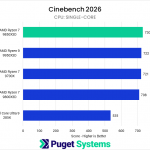
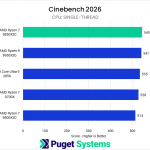
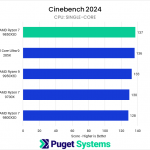
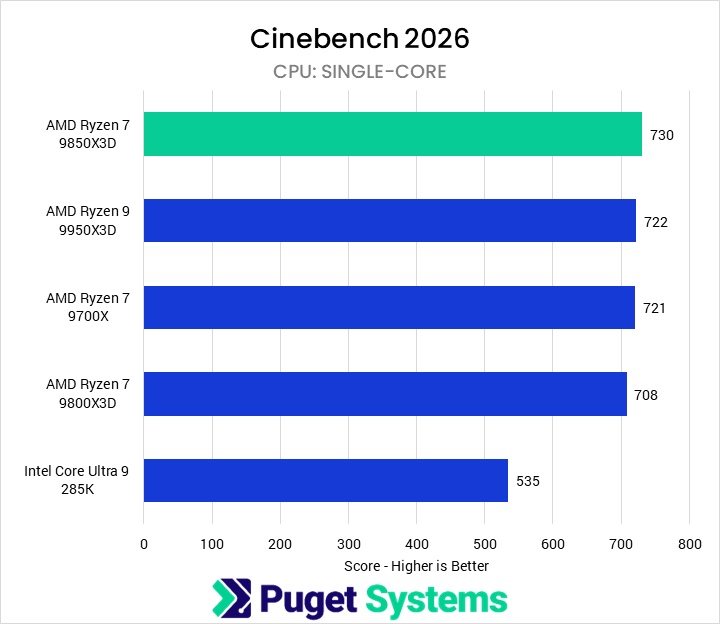
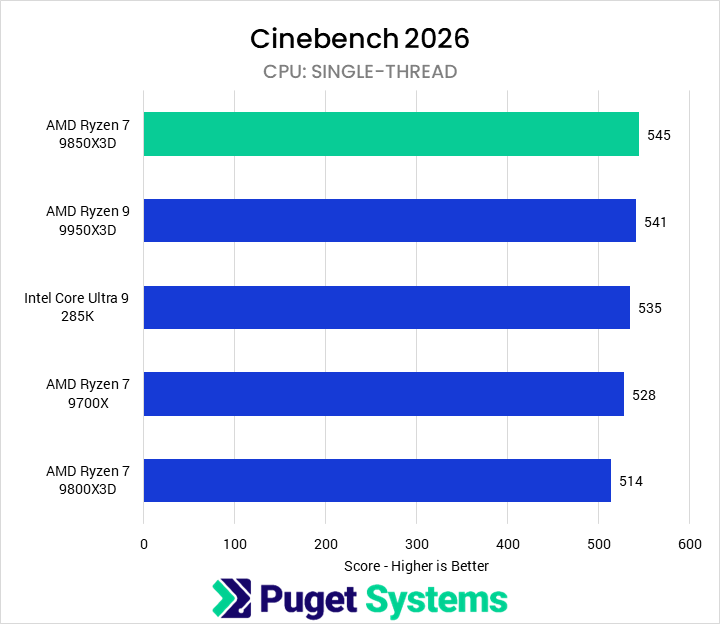
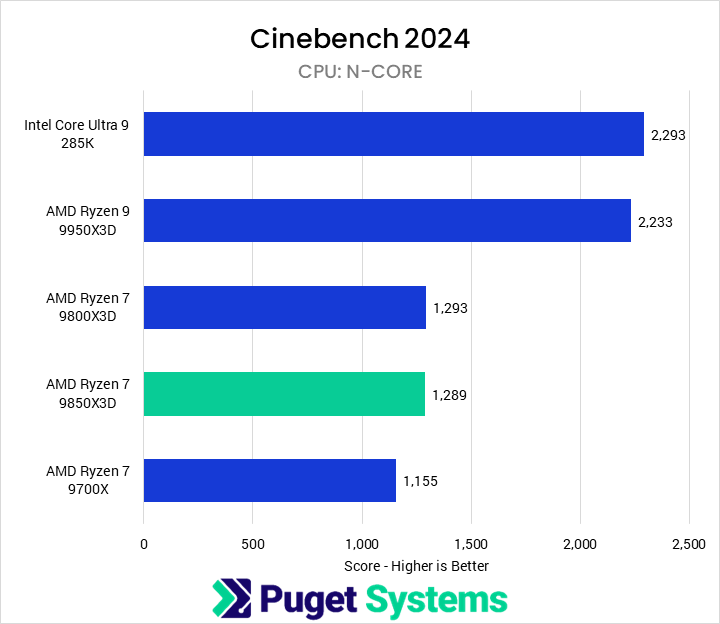
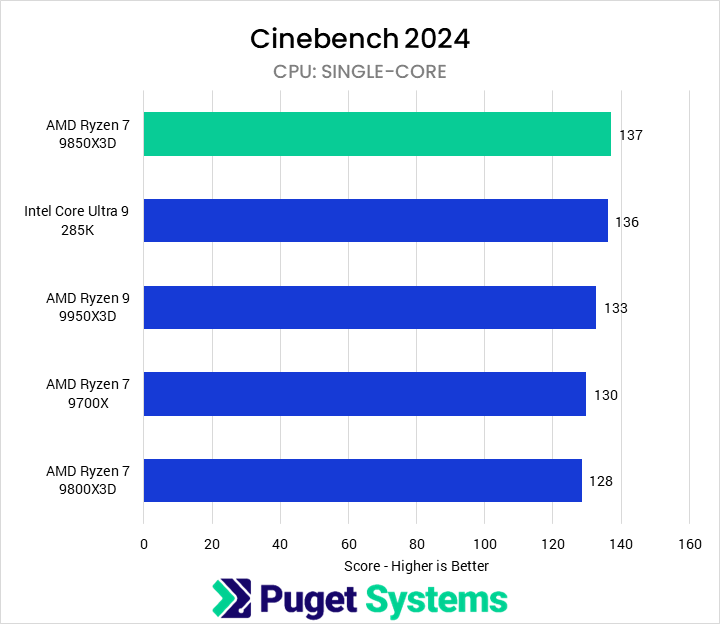
Starting with Cinebench 2026, we have three sets of tests: multicore (or N-Core, Chart #1), single-core (Chart #2), and single-thread (Chart #3). Chart #2 is a new one for Cinebench and, in our opinion, largely useless, as it just shows that SMT is functional as a technology; though it could be interesting to examine it across generations. In multi-core performance, we found that the 9850X3D and 9800X3D performed about the same, within 2%. However, the 9850X3D did do very well at the single-threaded test, leading the 9800X3D by 6%.
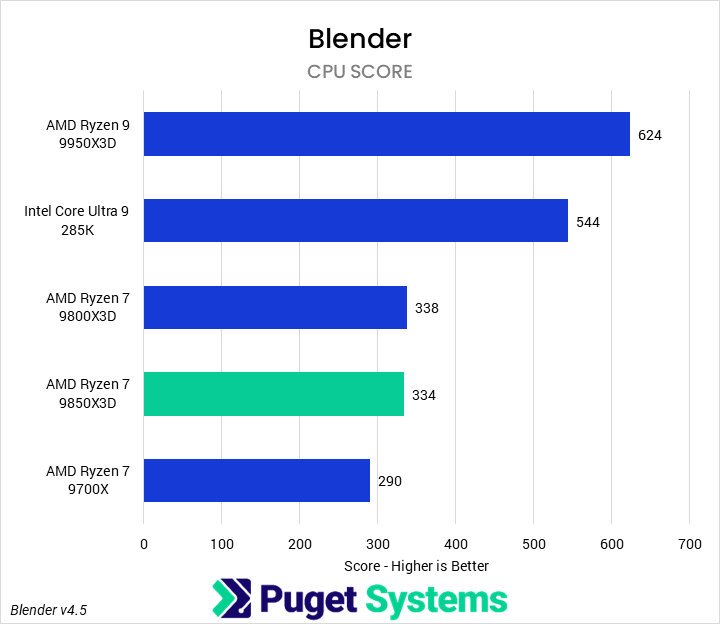
In both V-Ray and Blender, the 9850X3D scored just below the 9800X3D, though within the margin of error. This did mean it was 13-16% faster than a 9700X, but even without our general reservations about using 8-core CPUs for rendering tasks, we would avoid the 9850X3D purely for rendering, as it fails to offer additional value.
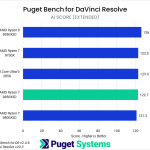
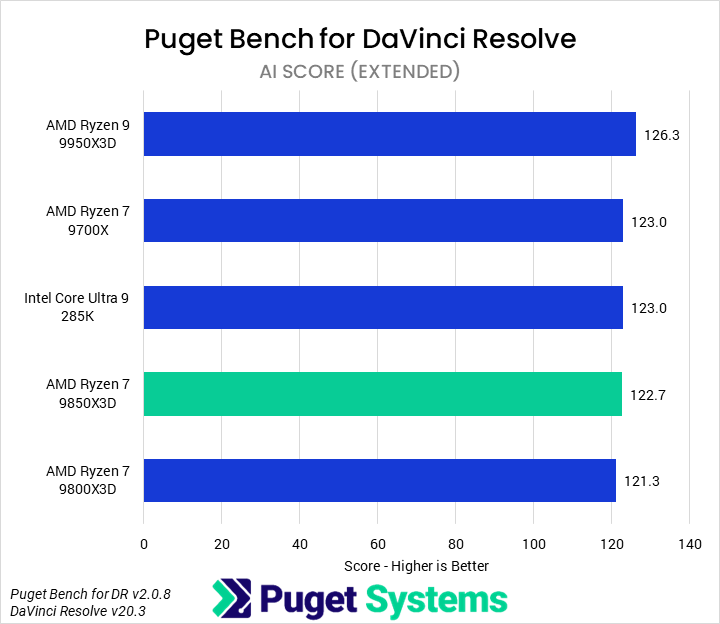
AI: LLM (Llama)

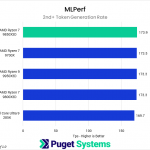
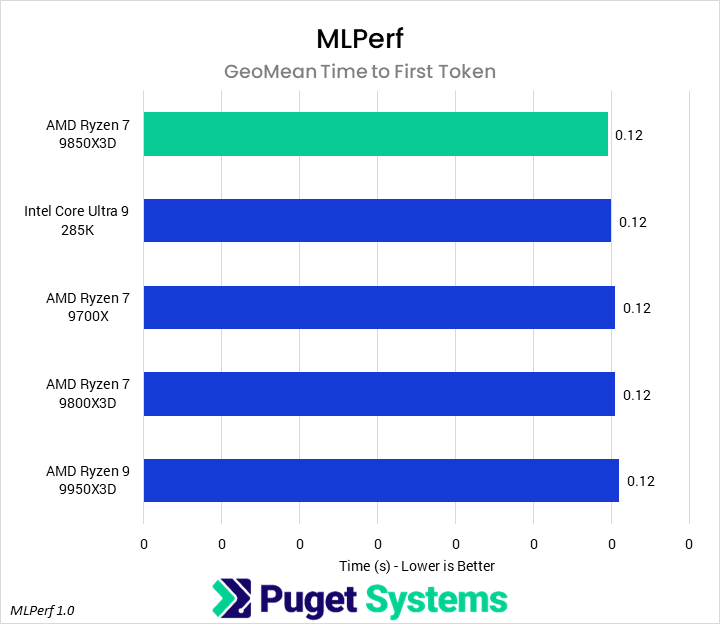
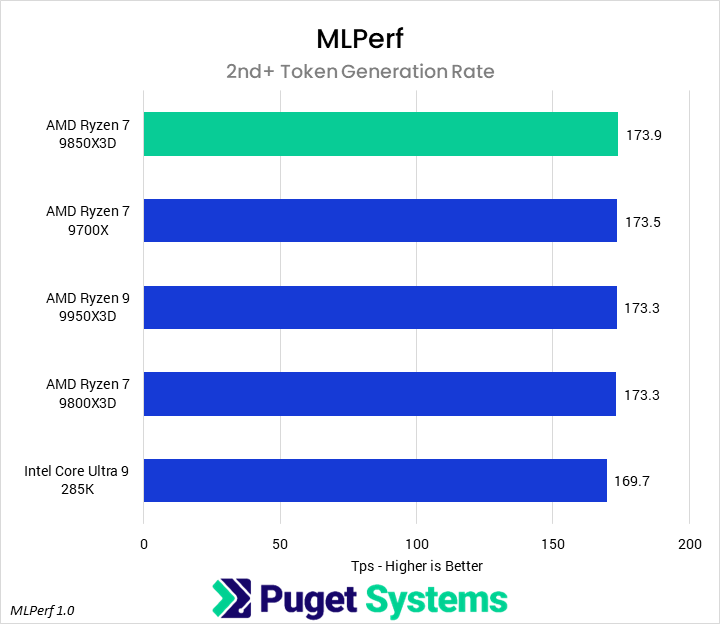
For AI workflows, we tested with an in-house LLM benchmark based on the Phi-3 Mini model, which runs directly on the CPU, as well as the MLPerf 1.0 benchmark, which primarily runs on the GPU. We didn’t expect to see much differentiation from the latter, and were correct in that assumption, but have included the results regardless.
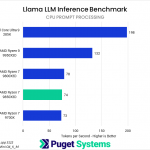
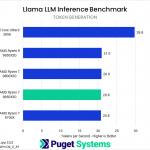
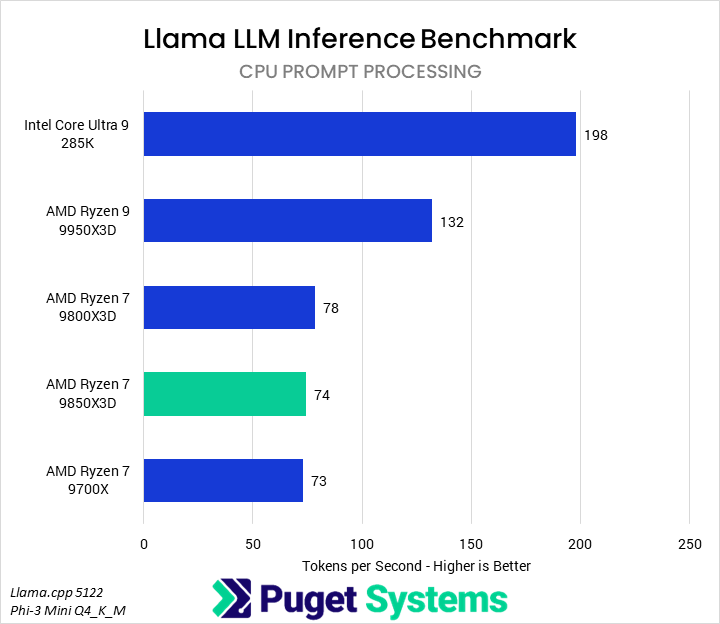
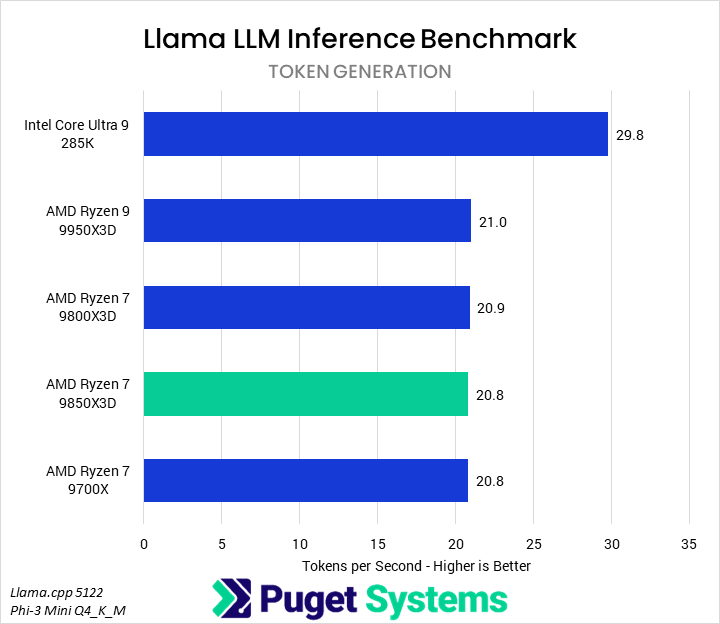
For our Llama LLM benchmark, we examined both the prompt processing and token generation steps of the question-response process. Starting with prompt processing (Chart #1), we found that workload scaled almost exclusively with the number of cores. The 285K led by a large margin, followed by the 9950X3D, and all three Ryzen 7 parts scored in a similar range well behind them. Token generation (Chart #2) was even more stark, as all of the AMD processors fell within 1% of each other.
Conclusion
The AMD Ryzen 7 9850X3D is an incremental improvement over the highly popular 9800X3D, featuring the same base specifications, save for a higher 5.6 GHz boost clock. As most professional content creation applications aren’t particularly sensitive to small frequency changes, we expected only marginal differences in performance. That expectation was largely correct, as the 9850X3D was on average 3% faster than the 9800X3D.
In video editing workflows, we found that the 9800X3D and 9850X3D performed identically. Photo editing in Photoshop, 3D work in After Effects, and tracking work in After Effects favored the 9850X3Ds’ increased clock speed, showing average improvements of about 4%. This also allowed the 9850X3D to outperform the 9950X3D by up to 7%, though the margin varied by task.
Heavy CPU tasks such as code compilation, rendering, and CPU-based LLM workloads showed no difference between the 9850X3D and 9800X3D. However, the 9850X3D did outperform the 9800X3D by 6% in the single-threaded Cinebench 2026 test. We similarly saw no differentiation in our real-time rendering benchmarks, though we suspect those were all GPU-bound, even at 1080p.
Overall, the 9850X3D seems like a competent successor to the 9800X3D, though we don’t imagine anyone upgrading from the latter to the former. Instead, assuming these CPUs maintain their relative price, we would recommend that anyone looking to purchase a 9800X3D consider a 9850X3D instead, if available. Professionals looking to use these processors for content creation should be sure to check out our previous 9950X3D review from last year to get a better look at how the 9800X3D (and thus, 9850X3D) stack up against the full range of Ryzen 9000 and Core Ultra 200K processors.
If you need a powerful workstation to tackle the applications we’ve tested, the Puget Systems workstations on our solutions page are tailored to excel in various software packages. If you prefer a more hands-on approach, our custom configuration page helps you configure a workstation that matches your needs. Otherwise, if you would like more guidance in configuring a workstation that aligns with your unique workflow, our knowledgeable technology consultants are here to lend their expertise.
Looking for a new desktop workstation?
We build computers tailor-made for your workflow.
Don’t know where to start?
We can help!
Get in touch with one of our technical consultants today.