Table of Contents
Introduction
One of the major tradeoffs when configuring a workstation with a consumer-class CPU is between memory capacity and speed. Although most motherboards of this type (with chipsets like X870 or Z890) feature four dual in-line memory module (DIMM) slots, the CPUs themselves are only designed with two memory channels. Installing more than two DIMMs causes the system to run in 2 DIMMs per channel (DPC) mode, necessitating a reduction in the maximum supported memory frequency. Thus, 4 DIMMs can offer higher RAM capacity but lower frequency, leading to the question: how much impact does this have on content creation performance?

Technical Background
With the explosion of growth in AI datacenters requiring large amounts of RAM, there has been a constriction in supply that has caused the cost of standalone DDR5 DIMMs and integrated GDDR for GPUs to increase dramatically. This has led many to evaluate how much, and how fast of, RAM they need. Even without those constraints, a frequent question our customers ask is whether they should increase the memory capacity of a system by using more DIMMs, as a form of future-proofing. Although this may seem like a no-brainer, provided someone’s budget allows for it, most desktop CPUs have lower maximum supported memory speeds with 4 DIMMs installed versus just 2 DIMMs.
To understand what we tested in this article, it may be helpful to give a brief (and simplified) explanation of how RAM works in a system. Most modern, consumer-grade desktop CPUs support two DDR5 RAM channels – each of which is a 64-bit connection between one or two RAM slots and the CPU’s memory controller. The total data throughput for a given configuration depends on the connector width times the memory frequency. This means that going from using one memory channel (with a single DIMM installed on the motherboard) to two (with one DIMM on each of two channels) doubles throughput. Similarly, doubling the frequency of the DIMMs also doubles throughput.
Many motherboards for these CPUs have four DIMM slots, meaning that each channel can be populated with two DIMMs. Doing so adds some electrical noise, but that is typically negligible, only substantially impacting overclockers.
DIMMs themselves contain a number of memory chips, which are grouped together in ranks. Chips within a rank are accessed simultaneously, while separate ranks are accessed independently. Typically, high-capacity DIMMs have more than one rank. Adding ranks to a channel, either by using DIMMs with more than one rank or by adding additional DIMMs per channel, adds load to the memory controller and increases overhead. Together, this requires a reduction in maximum memory frequency, especially when the ranks are split across multiple DIMMs in a channel.
Here are charts showing the officially supported memory speeds for current CPUs, and how they vary depending on rank and number of DIMMs per channel:
Intel Core Ultra 200
| DIMM Type | DIMM Ranks | 1DPC Frequency | 2DPC Frequency |
|---|---|---|---|
| CUDIMM | Single Rank | 6400 | 4800 |
| CUDIMM | Dual Rank | 5600 | 4400 |
| UDIMM | Single Rank | 5600 | 4800 |
| UDIMM | Dual Rank | 5600 | 4400 |
AMD Ryzen 9000
| 1DPC Frequency | 2DPC Frequency |
|---|---|
| 5600 | 3600 |
AMD does not officially support CUDIMMs and does not downclock based on DIMM Ranks, though DIMM ranks will affect overclocking stability and potential.
As shown, going from 1 DIMM per channel (DPC) to 2DPC will reduce the maximum frequency, often dramatically. For example, AMD’s Ryzen 9000 Series drops from 5600 MT/s to 3600 MT/s in that situation. Intel is a bit more complicated, with Arrow Lake processors downclocking in steps from as high as 6400 MT/s with single-rank CUDIMMs, to 5600 with single- and dual-rank DIMMs, to 4800 MT/s with single-rank 2DPC setups, and finally to 4400 MT/s with dual-rank 2DPC configurations. There are some technologies like rank interleaving that try to offset this penalty, or otherwise leverage multiple ranks, but while those can increase throughput with multiple ranks, they won’t do enough to offset the frequency loss from 2DPC configurations.
This means that increasing RAM capacity may result in slower memory speeds. However, if the amount of RAM a given workflow needs exceeds available capacity, then the excess is written to a pagefile on the drive instead – resulting in far worse performance than slower RAM, and potentially even application crashes. You should always ensure that you have enough memory to start with, but once you reach that point, more may not improve performance and could even reduce it. So, how much performance do you lose when crossing the line from 1DPC to 2DPC?
Test Setup
Intel Core Ultra Test Platform
| CPUs: Intel Core™ Ultra 9 285K |
| CPU Cooler: Noctua NH-U12A |
| Motherboard: ASUS ProArt Z890-Creator WiFi BIOS version: 2302 |
| RAM: 2x Kingston FURY Renegade 24GB (48 GB total) |
| GPUs: NVIDIA GeForce RTX™ 5080 Driver Version: 591.74 |
| PSU: Super Flower LEADEX Platinum 1600W |
| Storage: Samsung 980 Pro 2TB |
| OS: Windows 11 Pro 64-bit (26200) |
AMD Ryzen Test Platform
| CPUs: AMD Ryzen™ 9 9950X3D |
| CPU Cooler: Noctua NH-U12A |
| Motherboard: ASUS ProArt X670E-Creator WiFi BIOS Version: 3402 |
| RAM: 2x Kingston ValueRAM 5600 32GB (64 GB total) |
| GPUs: NVIDIA GeForce RTX™ 5080 Driver: 591.74 |
| PSU: EVGA SuperNOVA 1200W P2 |
| Storage: Kingston KC3000 2TB |
| OS: Windows 11 Pro 64-bit (26200) |
Benchmark Software
| Photoshop 27.2 – Puget Bench for Photoshop 1.0.5 |
| After Effects 25.6 – Puget Bench for After Effects 1.0.1 |
| DaVinci Resolve 20.3 – Puget Bench for DaVinci Resolve 1.2.2 |
| Unreal Engine 5.5 |
| PIX4Dmatic v1.81.1 — 100 image dataset (methodology) |
| V-Ray 6.00.01 |
| MLPerf Client v1.0 |
| Llama.cpp 5122 |
| MLC v3.12 |
| Linpack 2024 |
To explore this subject, we tested an Intel Core™ Ultra 9 285K and an AMD Ryzen™ 9 9950X3D – both equipped with an NVIDIA GeForce RTX™ 5080. These are the top-end CPUs for their respective families, so they should maximize RAM demands for a given workload. The specific motherboard and drive don’t matter much here, as we weren’t overclocking or paging out, but those details (and more) are listed in the expandable section above.
There is one quirk we must admit to, though. For the Intel platform, we tested with 2-4 Kingston Fury Renegade DIMMs, all of which were single rank. Therefore, on our 2DPC config, we manually downclocked and fixed timings to “simulate” a quad-rank 2DPC setup. This could have a slight impact on overall bandwidth compared to a true quad-rank 2DPC configuration. Although XMP kits, the Fury Renegade DIMMs are CUDIMMs, allowing us to test up to 6400 MT/s without overclocking.
AMD doesn’t list a difference between ranks in their provided guidance, and also doesn’t support CUDIMMs on current CPUs. With that in mind, and since we are sticking to official memory speeds for this article rather than overclocking, we decided to test the Ryzen platform with the RAM our Labs systems are normally configured with: 2-4 Kingston ValueRAM dual-rank DIMMs. It will be interesting to see if there is a difference in behavior between 1 vs 2 DPC configurations on Intel and AMD, as that could be a byproduct of different memory controllers and might merit further examination in the future.
Our platforms were configured as usual for our testing: overclocking features were disabled, the Core Ultra CPU was set to the Intel Performance Profile, and the RAM was running at the JEDEC speeds and timings for a given frequency (“B” spec). Drivers and Windows were up to date, and features like VBS were enabled. Since we are only looking at relative performance between memory configurations, we don’t expect these changes to make a significant difference.
We took something of a shotgun approach to this testing. Isolating memory performance requires far more benchmark passes than normal, so we needed to limit the number of applications we were testing. However, we wanted a broad swath of applications to try and characterize as many workloads as possible. We also wanted to make sure to include benchmarks that we haven’t profiled for RAM speed before, such as in our 2023 RAM speed article.
This means that we ended up testing with Photoshop, After Effects, DaVinci Resolve, V-Ray, Unreal Engine, MLPerf, our in-house Llama.cpp benchmark, Pix4D, and LinPack. We also used Intel MLC to examine the maximum memory bandwidth of each configuration. We have grouped these tests into categories to give broad overviews of different workflows, so this article may read a bit differently than normal.
Media & Entertainment — Photoshop, After Effects, & DaVinci Resolve
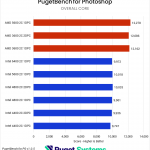
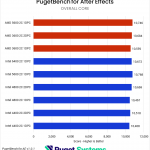
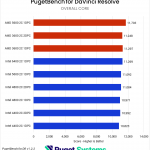
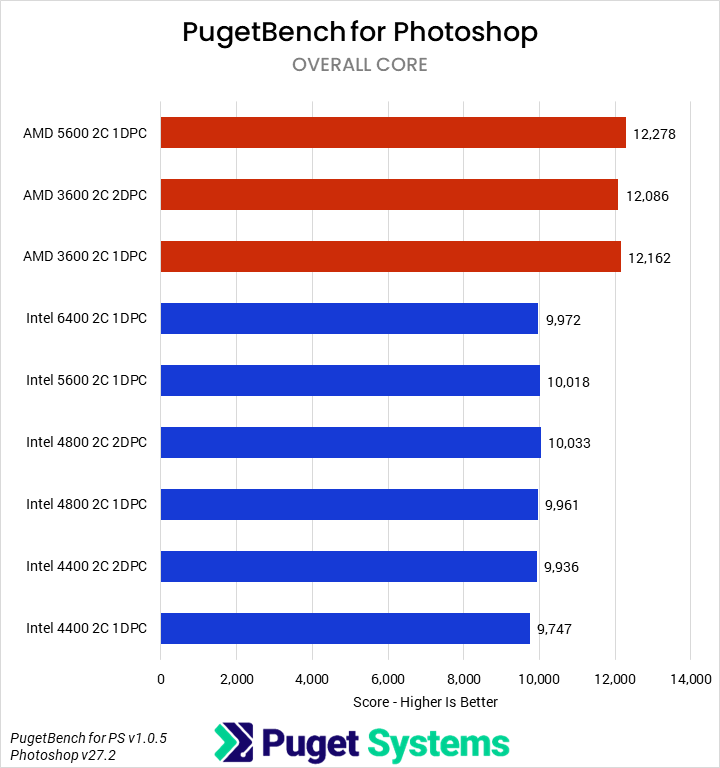
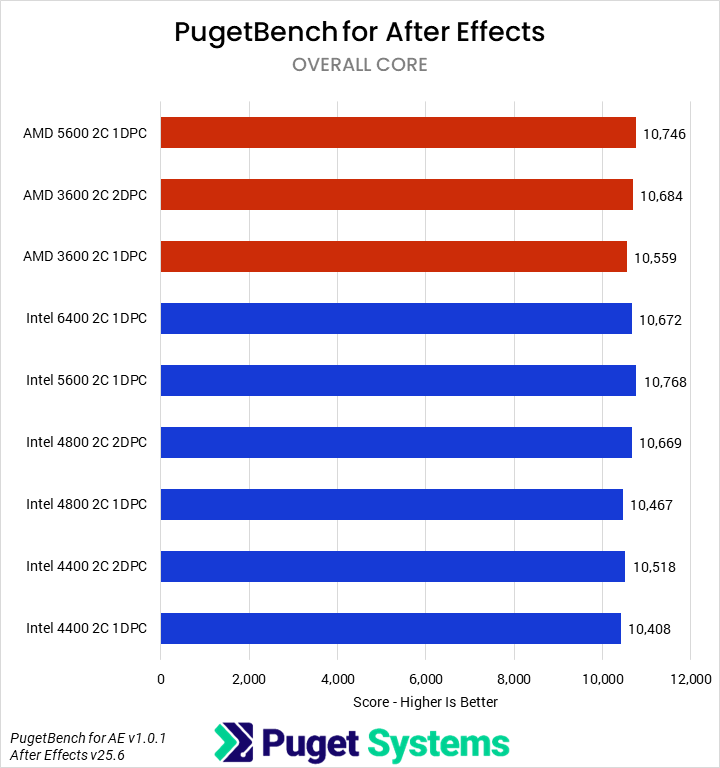
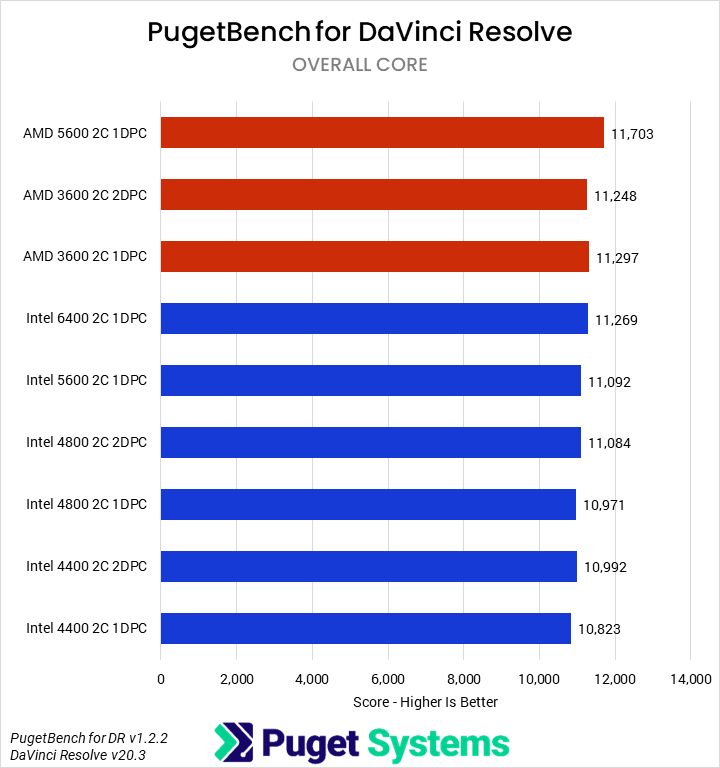
Starting off with our media & entertainment category, we examined the impact of RAM on Photoshop, After Effects, and DaVinci Resolve. Overall, the differences were very minor. For Intel, going from 6400 1DPC to 4400 2DPC only dropped average performance by about 2%, with After Effects dropping the most (3%) and DaVinci and Photoshop less (~1%). AMD was similar overall, though interestingly, DaVinci saw the biggest losses (4%) and After Effects the smallest (1%). We are reasonably confident that these results are accurate down to about 1%, but even if statistically significant, they are not actually impactful in terms of user experience. That is good news: users of these sorts of applications need not worry about slower RAM due to the inclusion of more DIMMs!
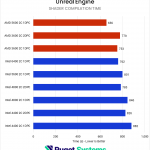
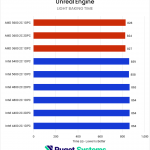
Game Dev – Unreal Engine
System Image
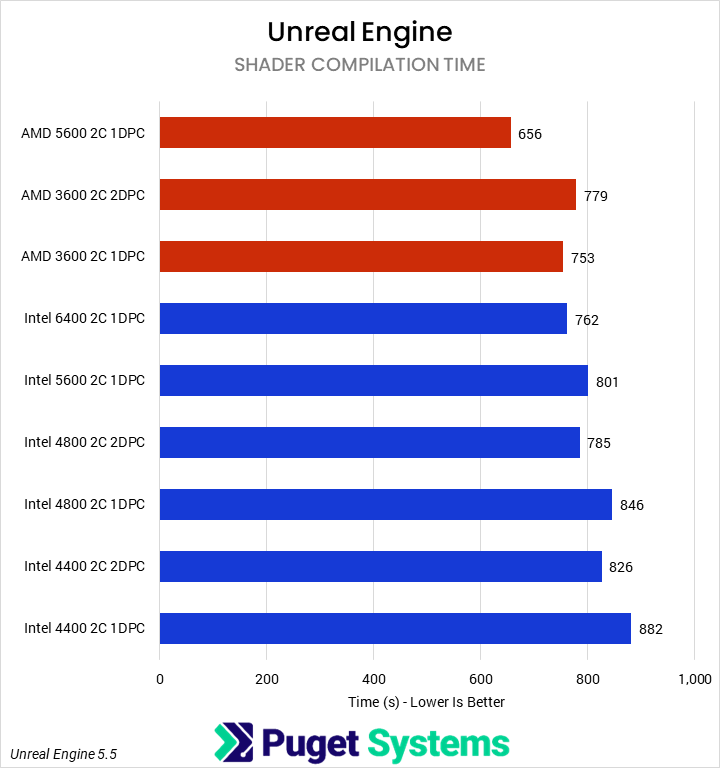
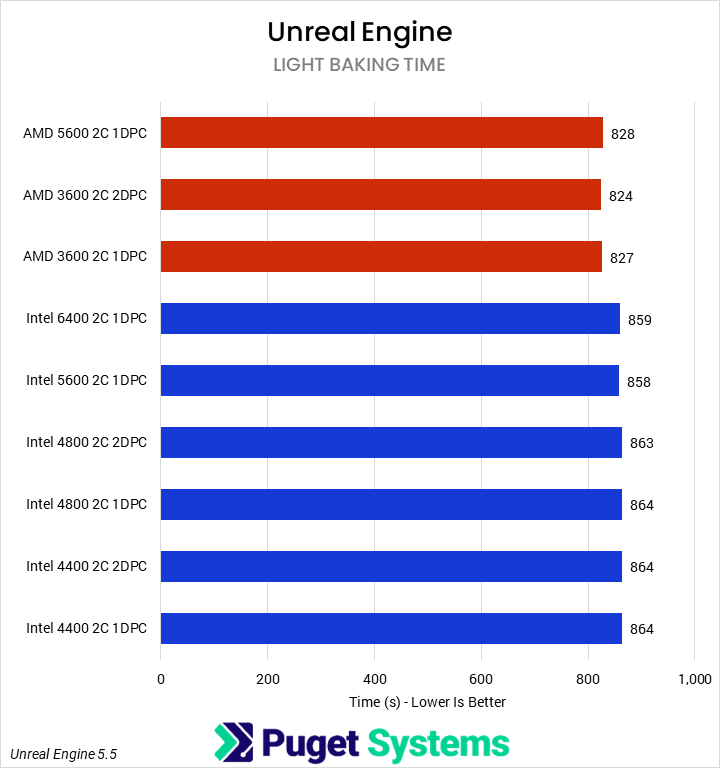
In past testing, we have found that many of our Unreal Engine benchmarks are sensitive to memory bandwidth and latency. That trend continued here, with shader compilation time exhibiting strong scaling. However, we did not see any impact on light baking performance.
For shader compilation time, the 4400 2C 2DPC Intel configuration performed 8% slower than the 6400 1DPC configuration and 3% slower than the 5600 configuration. We did see benefits from rank interleaving, though, with 2DPC results outperforming 1DPC by about 7% at the same frequency.
It was worse for AMD, where the 5600 1 DPC setup was 13% faster than 3600 2DPC. Overall, for both platforms, these are significant reductions that end-users should take into consideration when deciding how to configure a system.
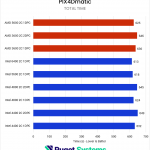
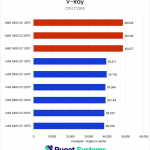
CPU Compute – PIX4Dmatic & V-Ray
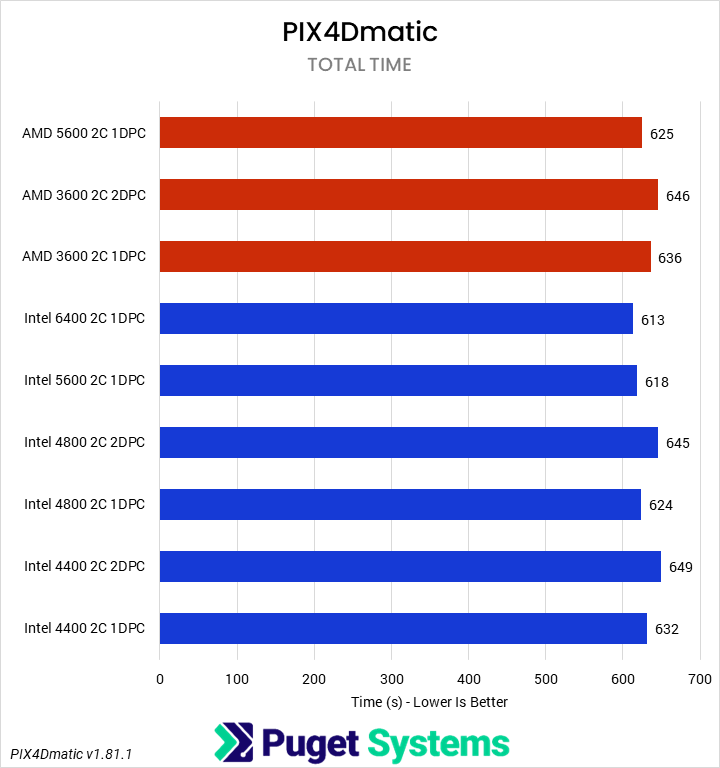
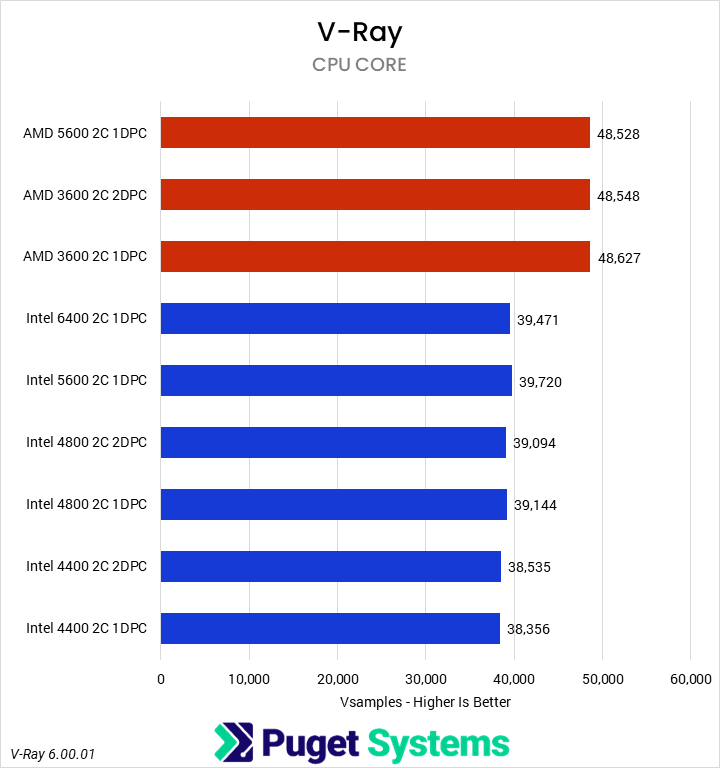
System Image
There aren’t a lot of unifying characteristics between V-Ray and PIX4Dmatic, but both are fairly heavy CPU loads, so we grouped them together for sake of space. Starting with PIX4Dmatic, we saw a roughly 5% performance drop on the Intel Core Ultra from the higher-frequency, single DPC setup to either of the lower-frequency, 2 DPC configurations. AMD was similar, with about a 4% drop. V-Ray, on the other hand, showed no change on AMD and a smaller 2-3% loss on Intel. It would be ideal to avoid the 4 DIMM configurations for PIX4D if possible, although with large projects that application can be memory-capacity constrained, so having enough RAM is more important than maximizing RAM speed. On the V-Ray side, and extrapolating out for CPU rendering in general, it won’t matter for most users.
AI – MLPerf & Llama.cpp
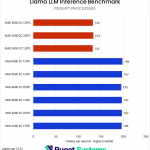
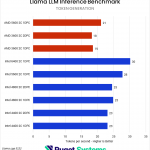
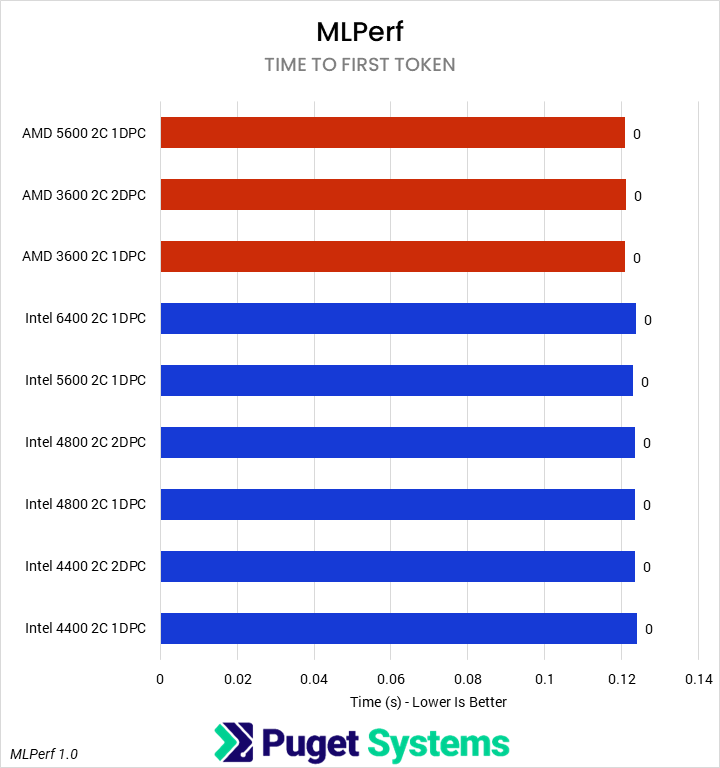
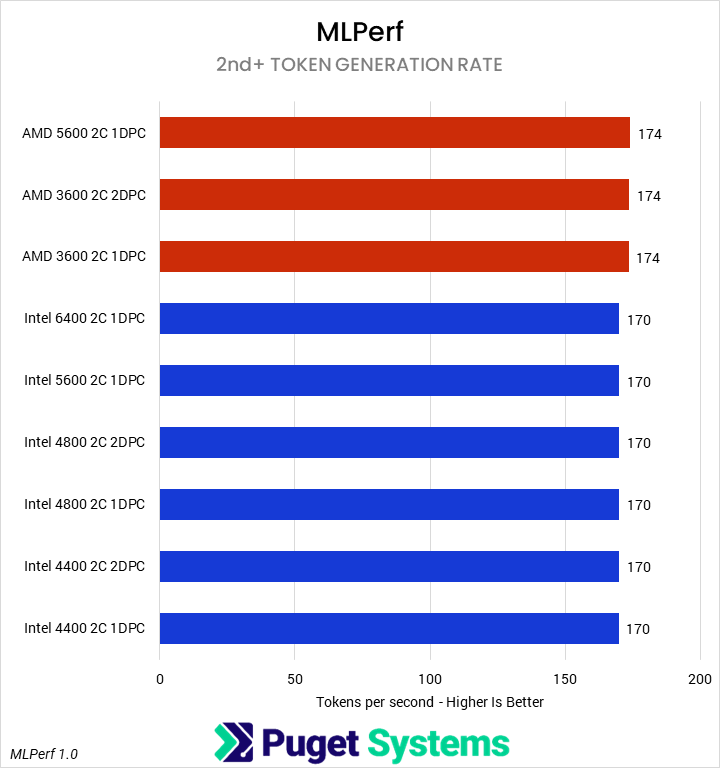
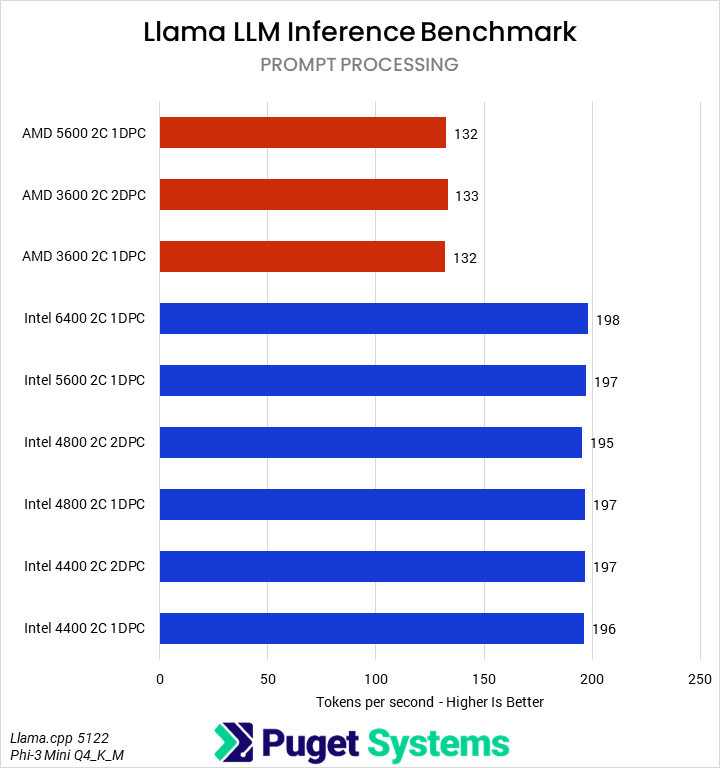
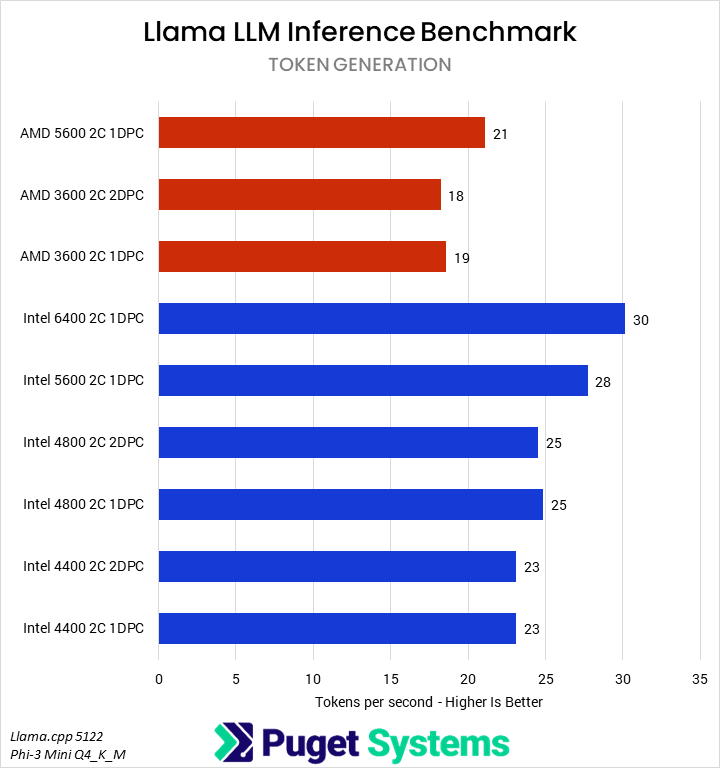
Our next set of tests were looking at two different LLM benchmarks: our internally-developed tool based on the Llama.cpp library and PHI-3 Mini Q4 model, and the industry-standard MLPerf 1.0 benchmark. The primary difference between these two is that the former runs natively on the CPU, while the latter principally uses the GPU – so we’re interested to see if how those two approaches are affected by system RAM.
Starting with the easy one first, we saw no difference in MLPerf performance between any of the RAM configurations. Llama.cpp was very different, with a slowdown of up to 25% in token generation on Intel and 12% on AMD when running with 4 DIMMs. We wouldn’t generally recommend running even a small LLM on a CPU when a GPU is available, but it does show the importance of memory bandwidth for these use cases.
Synthetic — MLC & Linpack
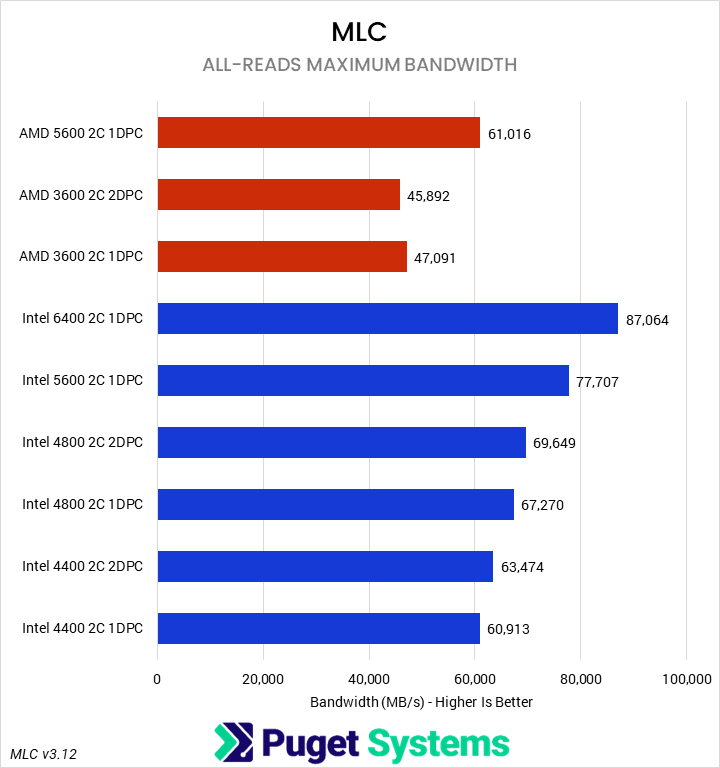
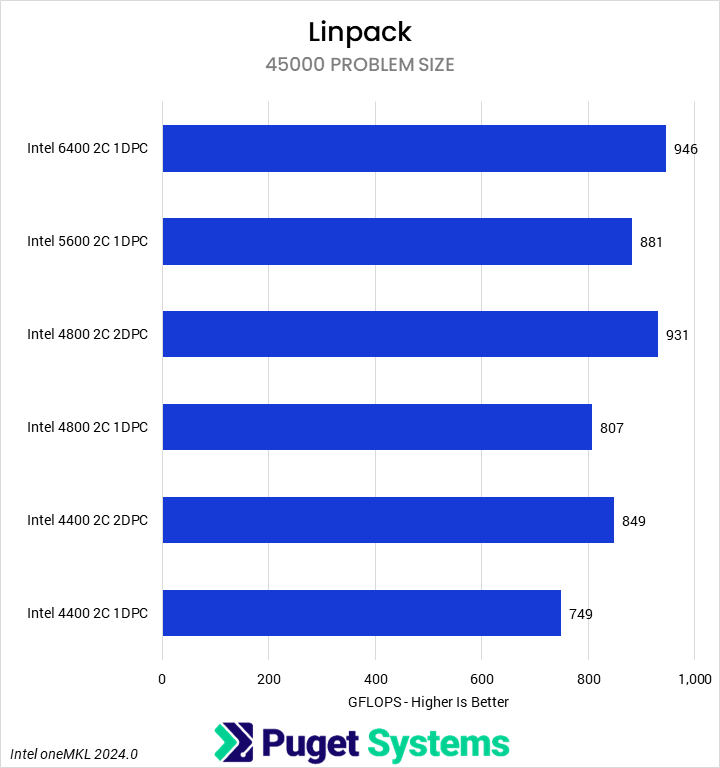
System Image
Our final set of benchmarks were a pair of more synthetic tests of memory sensitivity. First, we recorded the maximum memory bandwidth using Intel’s Memory Latency Checker (MLC). This provided a real-world measure of the bandwidth reduction from constraining RAM frequency. As expected, we saw substantial impacts as the frequency dropped, with the Intel 1DPC configurations closely tracking the theoretical reduction. We were able to see the benefits of rank interleaving, though, with 2DPC configurations outperforming 1DPC configurations at the same frequency. AMD was similar in terms of the impact of lower frequencies, though here the 2DPC setup was slightly slower than 1DPC. This may be due to overhead or loosed secondary timings resulting from the four-rank configuration.
The LINPACK executable we used only natively supports Intel, and we did not have the chance to recompile it for AMD support. Overall, we saw a 20% reduction in performance from the fastest to slowest RAM, though we found that LINPACK did benefit from increased capacity and/or rank interleaving, as our four-DIMM setups outperformed the two-DIMM setups at the same frequency.
How Much Performance Do 2DPC Configurations Give Up?
To examine the overall performance impact of running two DIMMs per channel on DDR5 memory frequency and timings, we normalized scores to the highest officially supported (non-CUDIMM) speeds – 5600 MT/s for Intel and 5200 MT/s for AMD – and then computed a weighted geometric mean of the normalized scores by and across categories. These can essentially be considered performance percentage ratios, and this analysis is summarized in the tables below:
| Normalized Scores | Intel 4400 2C 1DPC | Intel 4400 2C 2DPC | Intel 4800 2C 1DOC | Intel 4800 2C 2DPC | Intel 5600 2C 1DPC | Intel 6400 2C 1DPC |
|---|---|---|---|---|---|---|
| Media & Entertainment | 97.18 | 98.65 | 98.51 | 99.72 | 100 | 100.08 |
| Unreal Engine | 95.05 | 98.19 | 97 | 100.77 | 100 | 102.52 |
| CPU Compute | 97.24 | 96.15 | 98.86 | 97.14 | 100 | 100.12 |
| AI | 95.26 | 95.44 | 97.25 | 96.69 | 100 | 102.07 |
| Synthetic | 81.61 | 88.69 | 89.05 | 97.29 | 100 | 109.66 |
| Overall Score | 93.07 | 95.35 | 96.06 | 98.31 | 100 | 102.83 |
| Normalized Scores | AMD 3600 2C 1DPC | AMD 3600 2C 2DPC | AMD 5600 2C 2DPC |
|---|---|---|---|
| Media & Entertainment | 97.94 | 97.97 | 100 |
| Unreal Engine | 93.34 | 91.96 | 100 |
| CPU Compute | 99.23 | 98.37 | 100 |
| AI | 96.77 | 96.46 | 100 |
| Synthetic | 77.18 | 75.12 | 100 |
| Overall Score | 96.79 | 96.16 | 100 |
Overall, we found that Intel’s Core Ultra was more sensitive to RAM frequency than AMD’s Ryzen, even accounting for the additional LINPACK scores affecting the Synthetic category. It is possible that this could, in part, be due to the large cache on the Ryzen X3D processor. On average, Intel saw a 3% improvement from faster 6400 MT/s RAM, and an up to 7% drop from the slowest memory configuration. In contrast, AMD averaged only a 4% drop. However, one quirk is that with single-rank DIMMs, Intel saw less of a drop than AMD, though we suspect most configurations would utilize dual-rank modules due to capacity constraints.
The Synthetic category was most affected, but that was to be expected. Otherwise, Unreal Engine was once again very sensitive to memory bandwidth, as were CPU-based LLM workloads, to a smaller extent. Media and entertainment apps were less affected.
Of course, as we noted in the intro, insufficient amounts of memory can impose a far worse performance (and even app stability) penalty. Thus, users should first evaluate how much memory they need to do their work and only then consider the implications of going to two DIMM per channel configurations. Generally speaking, though, two higher capacity DIMMs will be better than four smaller modules.
If you need a powerful workstation to tackle the applications we’ve tested, the Puget Systems workstations on our solutions page are tailored to excel in various software packages. If you prefer a more hands-on approach, our custom configuration page helps you configure a workstation that matches your needs. Otherwise, if you would like more guidance in configuring a workstation that aligns with your unique workflow, our knowledgeable technology consultants are here to lend their expertise.
Looking for a new desktop workstation?
We build computers tailor-made for your workflow.
Don’t know where to start?
We can help!
Get in touch with one of our technical consultants today.