Table of Contents
Introduction
This year at COMPUTEX, Intel unveiled its latest offering in the GPU segment. The Intel® Arc™ Pro B50 is a compact video card designed for professional workstations and local inference use. Positioned as a direct competitor to NVIDIA’s RTX™ A1000, it is exciting to see competition in the entry-level workstation graphics space.
Image
Like the rest of the Battlemage line, the Arc Pro B50 is based on Intel’s Xe2 architecture. It offers architectural improvements over the 3-year-old Arc Pro A50. The second-gen Xe cores promise major efficiency improvements and offer SIMD16 execution (1st-gen Xe cores supported only SIMD8). This also means new, second-gen Ray Tracing Units (RTUs) and XMX engines (specialized matrix engines, similar in purpose to NVIDIA’s Tensor cores).
As was the case with the consumer-oriented Arc B580 we reviewed late last year, the B50 has dual media engines. Each has an encoder and decoder for up to two 8K 10-bit workloads. In terms of codec support, Intel’s media engine has acceleration for HEVC 8, 10, and 12-bit (decode only) 4:2:0, 4:2:2, and 4:2:0, as well as AV1, among other codecs. The 10-bit 4:2:2 support is unique in the entry-level space but probably not too notable for most use cases.
Of course, this being a “Pro” GPU, the B50 also includes the usual professional features. This includes certified drivers and testing to ensure stability and reliable performance on both the hardware and software side. Intel has also worked to certify the B50 with various ISVs such as Adobe, Autodesk, and Dassault Systèmes, among others; Intel claims more than 50 of these certifications. Intel has also been working on containerized Linux environments optimized for LLMs with Intel hardware.
Below, we have listed the most relevant GPU specifications from Intel and NVIDIA:
Specification-wise, the Arc Pro B50’s most impressive feature is its large VRAM buffer. We have previously complained about the restrictive memory capacity on lower-end GPUs, so we appreciate Intel’s decision to fit the B50 with a full 16 GB. That is over two-and-a-half times the 6 GB found on the prior-gen A50. This elevates the B50 from a card limited to the most basic of tasks to one capable of handling small local AI models, complex CAD, and lots of multitasking. It will also help with some gaming on the side, though power restrictions may hamper that overall experience.
Otherwise, Intel has essentially doubled the A50: the B50 has twice the number of Xe cores and ray tracing units. Alongside improved XMX engines and slightly elevated boost clocks, this results in more than double the peak TOPs.
One change from the initial announcement is the price. Unfortunately, Intel could not maintain the $300 price tag announced at COMPUTEX, instead starting the SEP at $350. It is understandable given the VRAM price costs in the channel and tariffs, and it is still cheaper than an NVIDIA RTX A1000, but in the low-end segment, every dollar hurts. Nevertheless, Intel still maintains a price advantage over the A1000, with more VRAM to boot.
Test Setup
Test Platform
| CPUs: AMD Ryzen™ 9 9950X3D |
| CPU Cooler: Noctua NH-U12A |
| Motherboard: ASUS ProArt X870E-Creator WiFi BIOS Version: 1605 |
| RAM: 2x DDR5-5600 32GB (64 GB total) |
| PSU: Super Flower LEADEX Platinum 1600W |
| Storage: Samsung 980 Pro 2TB |
| OS: Windows 11 Pro 64-bit (26100) Power Profile: Balanced |
NVIDIA GPU
| NVIDIA RTX™ A1000 Driver: 581.15 |
Intel GPUs
| Intel® Arc™ Pro B50 Intel® Arc™ Pro A50 Driver: 101.6979 |
Benchmark Software
| Adobe Photoshop 26.10 — Puget Bench for Photoshop 1.0.5 |
| Adobe Premiere Pro 25.2.3 — Puget Bench for Premiere Pro 1.1.1 |
| After Effects 25.4 – PugetBench for After Effects 1.0 |
| Blender 4.5.0 |
| MLPerf Client v1.0 |
| Autodesk Revit 25.3 — RFO Benchmark 3.4 |
| Autodesk Inventor 29.0 — InvMark 2025.0.15 |
| SOLIDWORKS 2024 5.0— SPECapc for SOLIDWORKS 2024.1.13 |
Our testing was performed on an AMD Ryzen™ 9 9950X3D socketed in an ASUS ProArt X870E-Creator WiFi motherboard. The 9950X3D has fantastic all-around performance in every workflow we have tested. This makes it an ideal platform to test GPUs, as it removes as many bottlenecks as possible. For our testing, we used the latest available GPU drivers. Our software packages are pretty typical for our GPU reviews, including most of the PugetBench benchmarks for Adobe applications and industry standard benchmarks such as Blender, V-Ray, Octane, and MLPerf. Excitingly, we were also able to include some CAD benchmarks for the first time in a number of years.
Photoshop
System Image
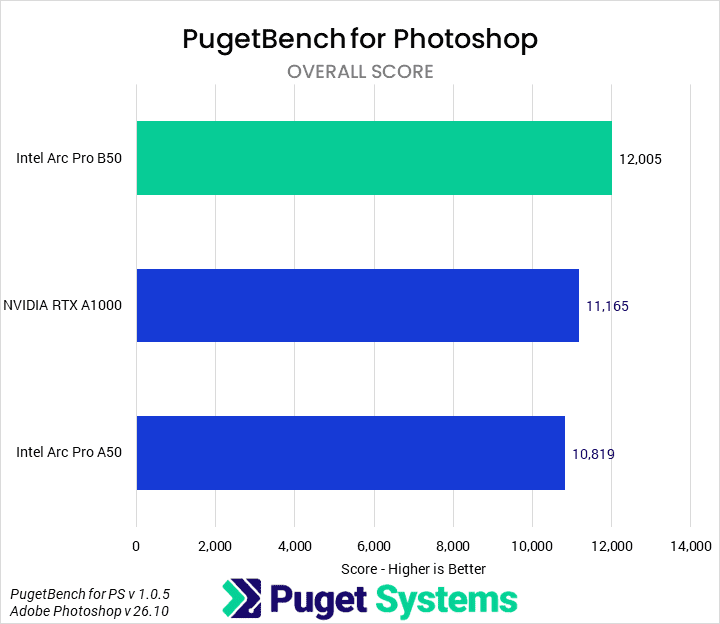
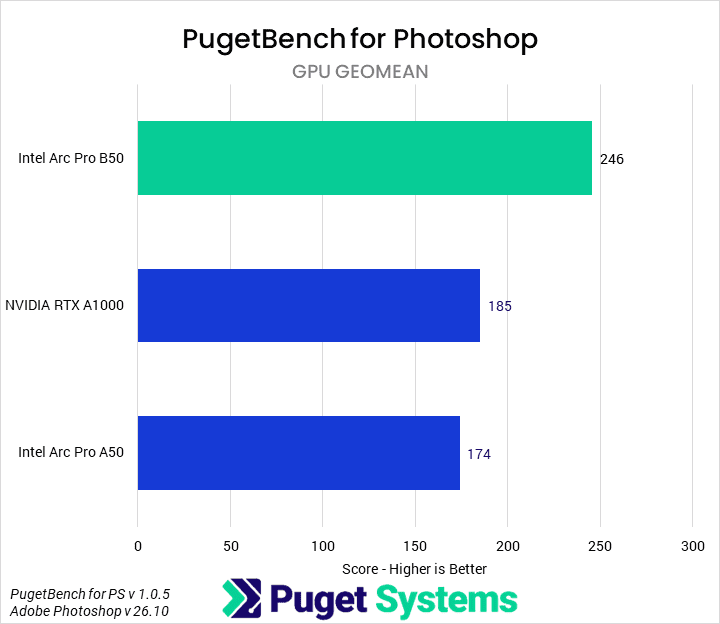
We don’t usually feature Photoshop on our GPU reviews, but at the entry-level price point, we thought it would be interesting to see if it had any effect on performance. Looking at the Overall Score (chart #1), we found that the Intel Arc Pro B50 was 7% faster than the NVIDIA RTX A1000 and 11% faster than the A50. This is a solid performance improvement, even if we don’t expect anyone to base their GPU purchasing decisions on Photoshop results alone.
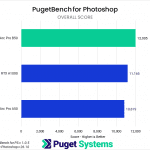
Out of curiosity, we also took a score geomean of the tests that we have typically found to utilize the GPU (chart #2). Looking only at these, the B50 has a 33% performance advantage over the A1000 and a 41% increase over the A50.
Premiere Pro
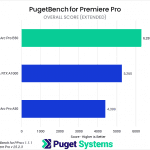


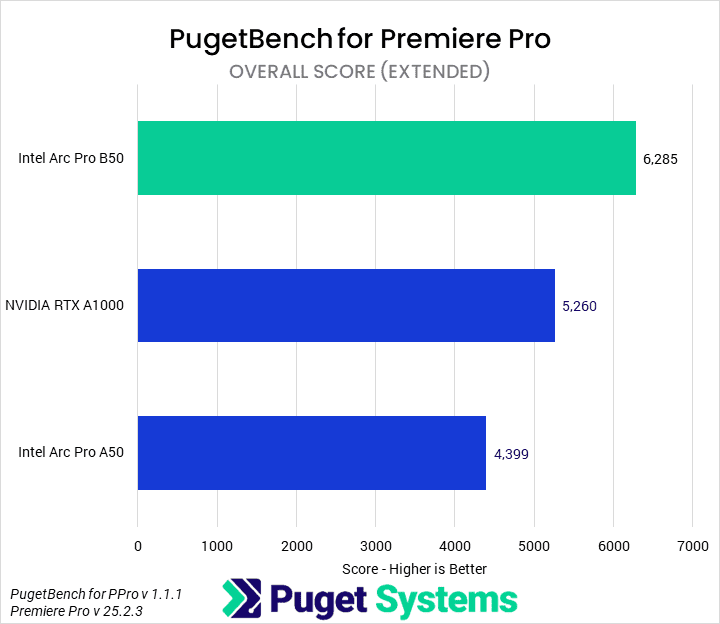
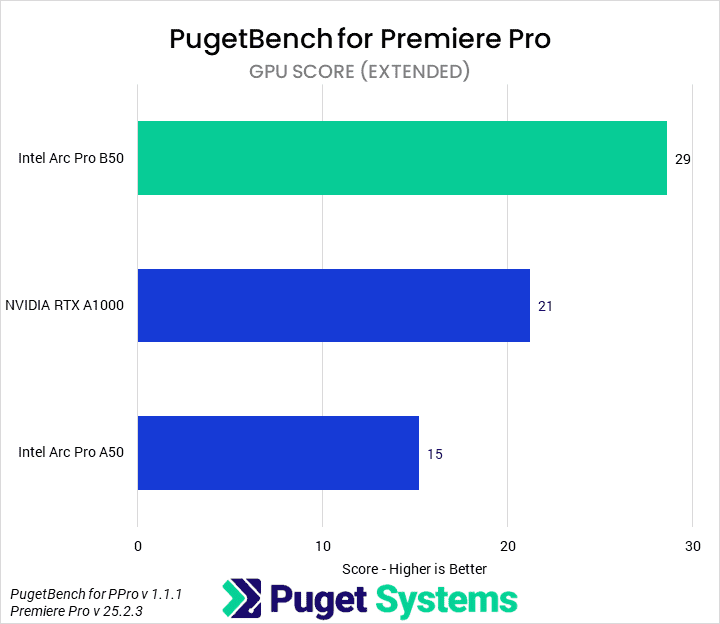
The next application we tested was Adobe Premiere Pro. Non-linear editors are typically a bit heavy for this class of video card, but we were interested to see if they could be effective and, especially, to see the performance of the media engines. Starting with the Overall Score (chart #1), we found that the B50 outperforms the other two GPUs. It was 19% faster than the A1000 and 42% faster than the A1000.
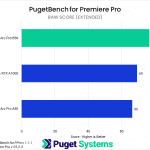
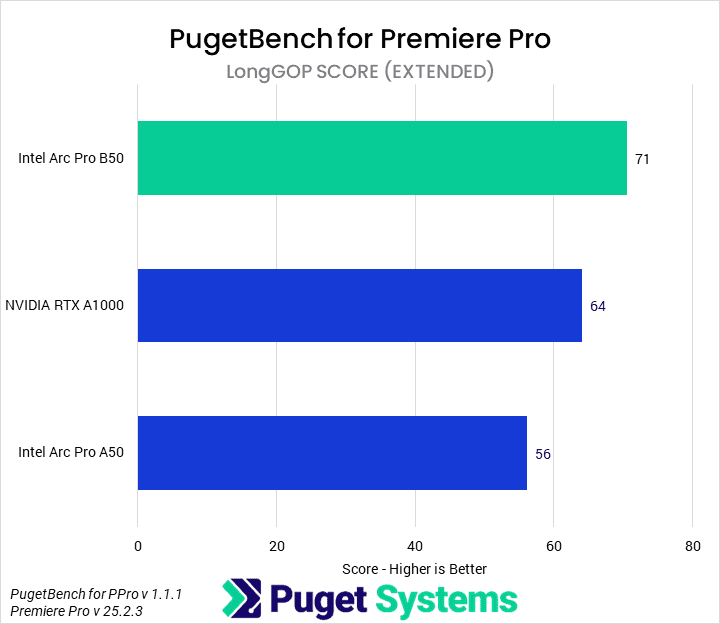
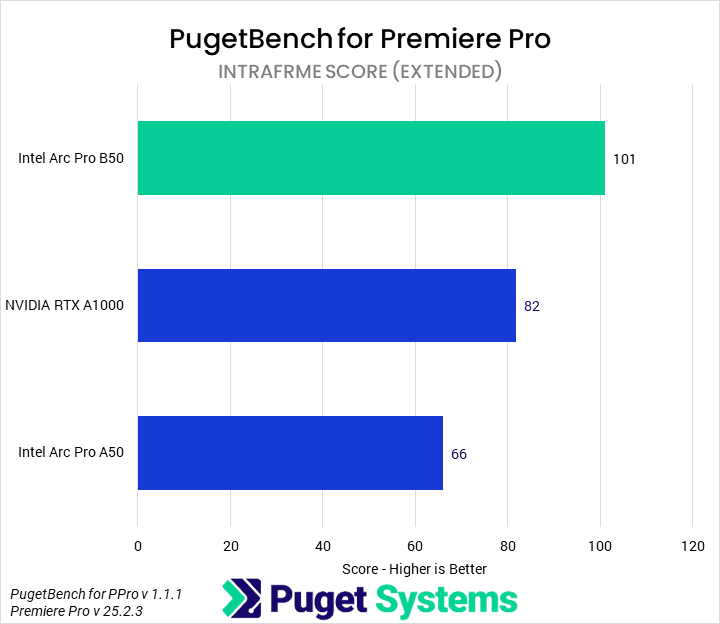
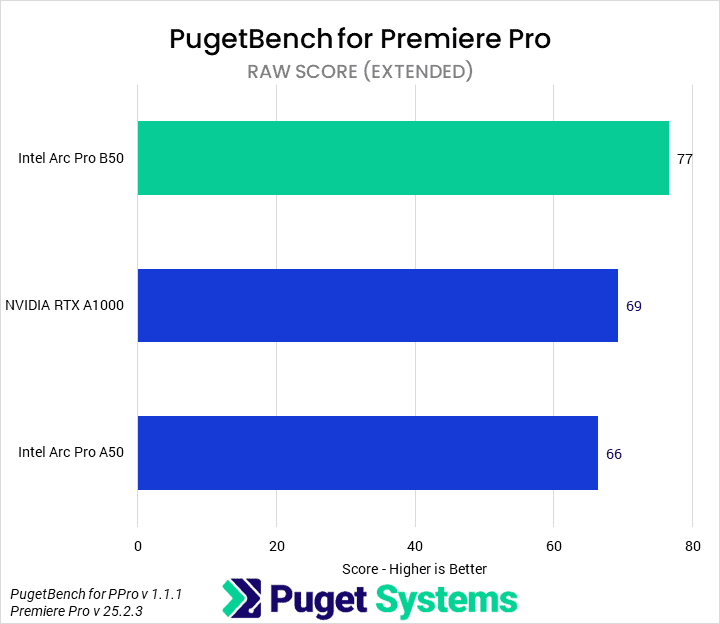
The media engines should have been apparent in the LongGOP score (chart #2). However, we didn’t see much to distinguish the B50 there at first: it was only 10% faster than the A1000 and 27% faster than the A50. Digging into the individual tests, we found that the B50 completed the 4:2:2 10-bit encoding tests 33% faster than the A1000. In Intraframe workloads (chart #3) the B50 was 23% faster than the A1000 and 53% faster than the A50, while with RAW codecs (chart #4) it was only 12% and 17% faster than those, respectively.
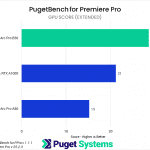
Finally, the area we expected to see the most differentiation was, of course, the GPU tests (chart #5). The Intel Arc Pro B50 performed very well in those, showing a 38% performance advantage over the A1000 and 93% generational improvement over the A50.
After Effects
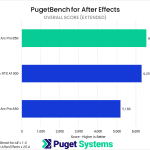
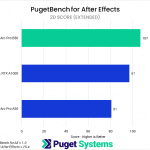
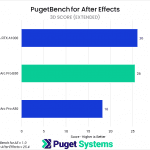
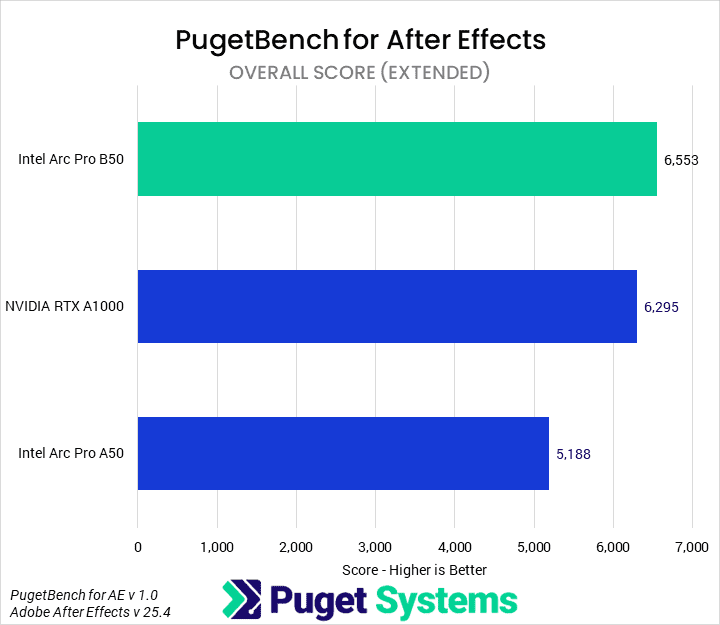
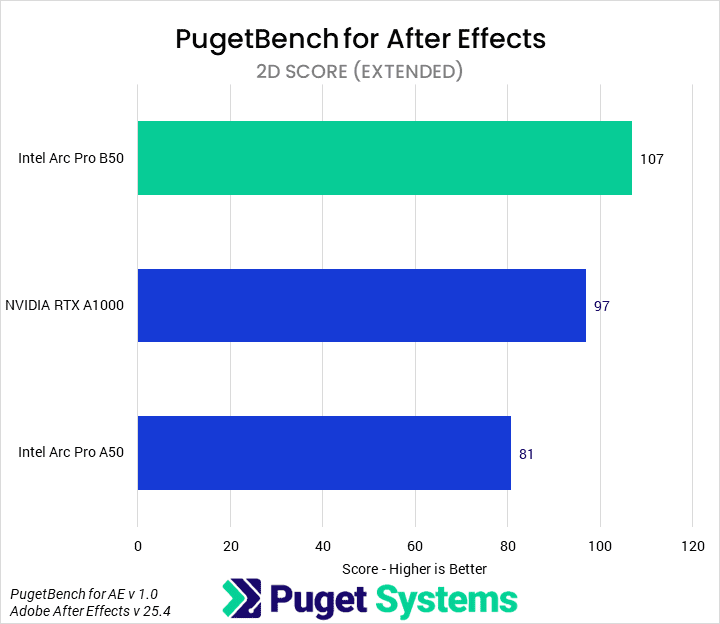
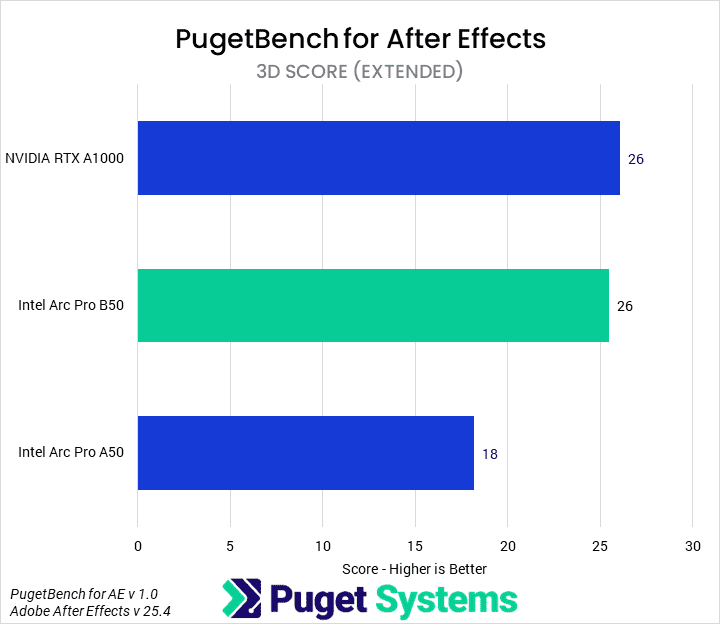
In After Effects, the overall score (chart #1) difference was relatively small. The B50 was only 4% faster than the A1000; this is typically within the margin of error. There were better generational improvements over the A50, amounting to about 30%. However, this was due to two factors pulling against each other. In 2D workflows (chart #2), the B50 was 10% faster than the A1000 and 32% faster than the A50. In 3D workflows (chart #3), the B50 scored equivalently to the A1000. It did manage a 44% generational improvement over the A50, though. 3D work in After Effects has historically been a strong area for NVIDIA, so it was impressive to see Intel match its competitor’s card.
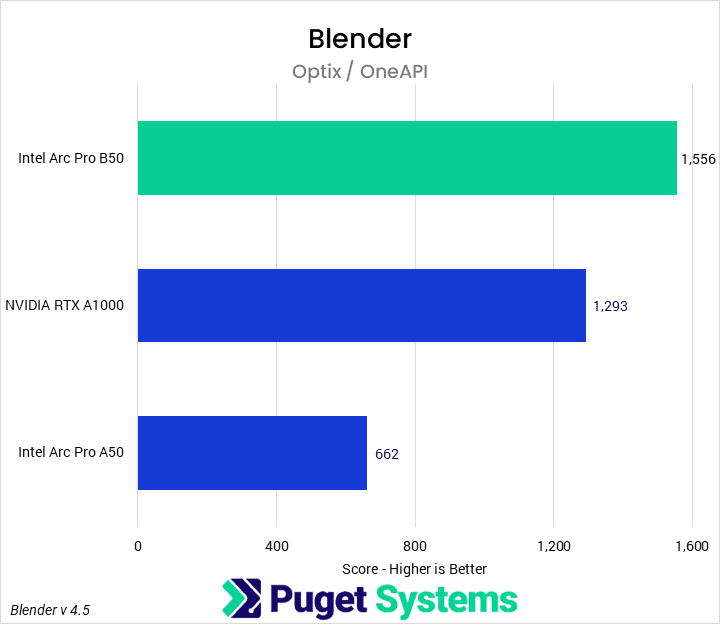
Blender
Image
Like 3D workflows in After Effects, GPU rendering has traditionally been an area of NVIDIA dominance. However, with the latest version of Blender, the Arc Pro B50 managed to outperform the A1000 by 20%. This was an impressive result made possible by a 135% improvement generationally. Alongside the 16 GB of VRAM, we think this positions the B50 as a serious rendering option in the entry-level workstation space.
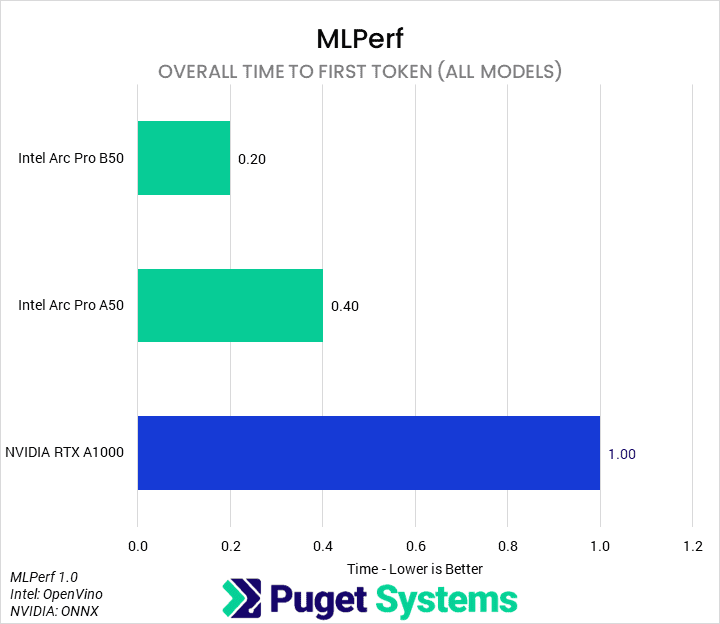
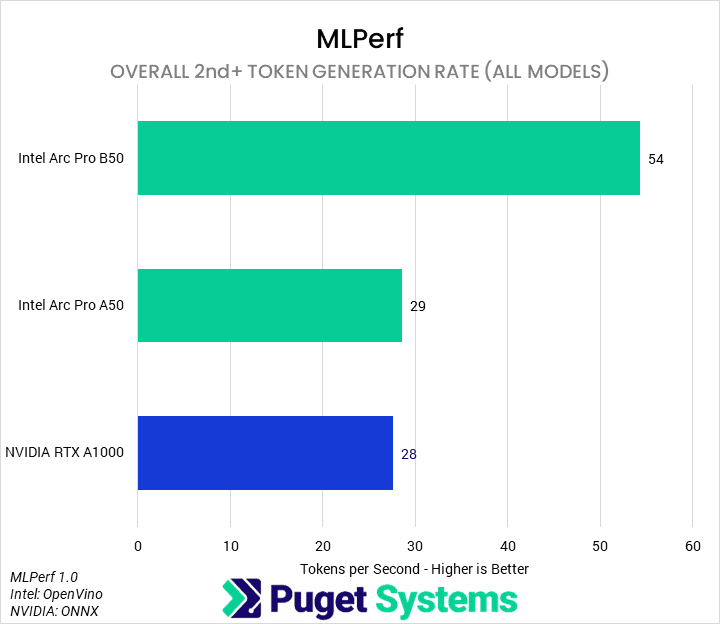
MLPerf


System Image
Next, we tested these GPUs in MLPerf by MLCommons. Starting with the All Models results for time to first token (chart #1), we found that the B50 took one-fifth as much time as the A1000 and one-half that of the A50. Similarly, in the second-token forward generation (chart #2), it managed 92% more tokens per second than the A1000 and A50. We think there may be some additional optimizations that could be done on the NVIDIA end, but this is still impressive both generationally and in raw performance.
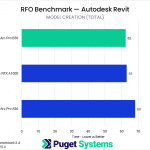
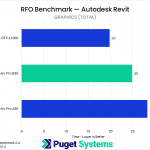
Revit
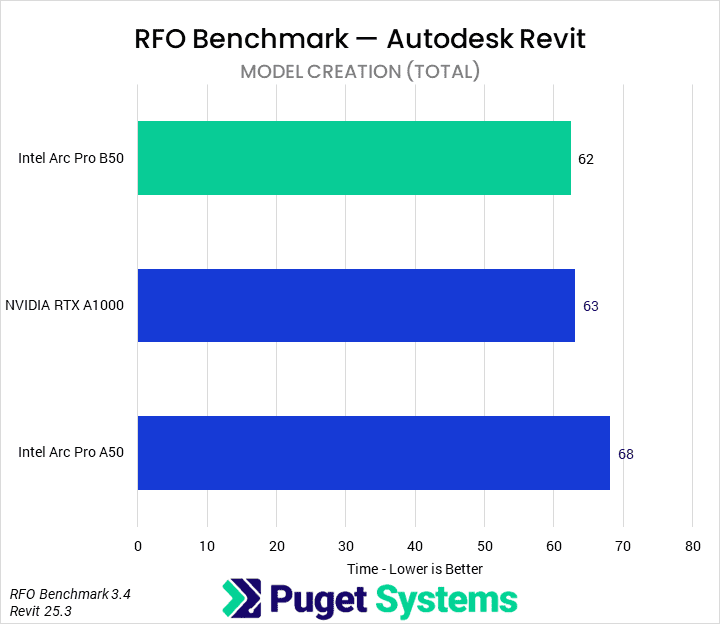
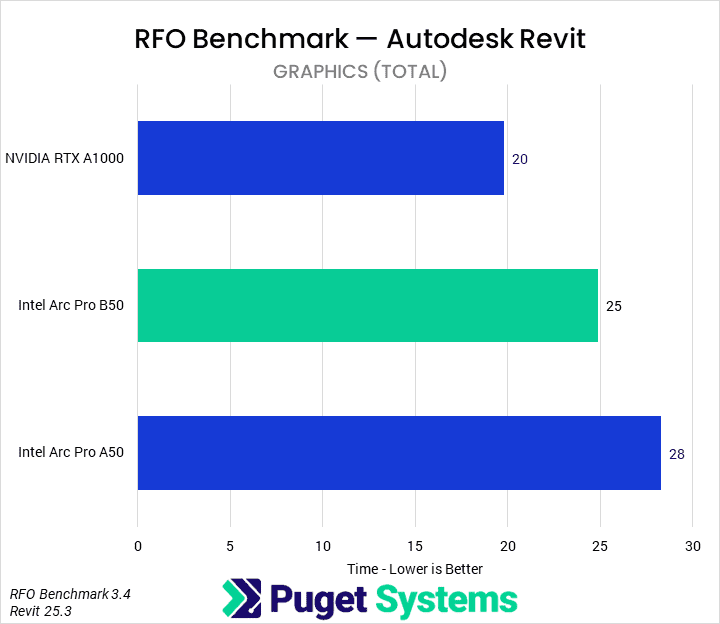
System Image
It has been a number of years since we have tested with Autodesk Revit using the RFO benchmark. We tested each of the GPUs using the Full_Standard preset at 4K resolution. In the future, we will likely include the Graphics_Expanded preset as well, as that may present a fuller picture of pure-GPU performance in Revit.
We pulled out the two major subscores from the results. In Model Creation (chart #1), the GPUs were essentially identical. Model creation is primarily CPU-bound, so we were unsurprised. Graphics (chart #2) uses the GPU much more, though it still has a healthy amount of CPU and I/O bound tasks. Here we found that the B50 was 20% slower than the A1000, but 11% faster than the A50. This isn’t a great result, but any of these GPUs is likely sufficient for a lot of Revit work, provided the CPU it is paired with is up to snuff.
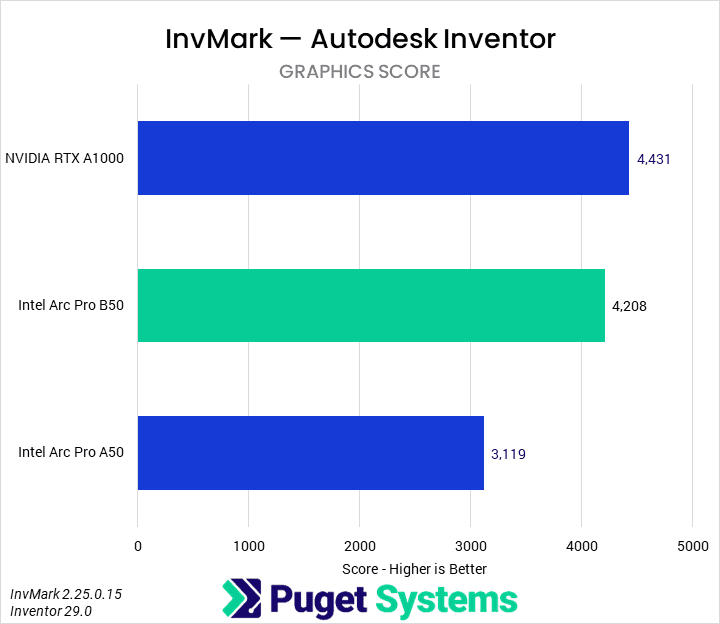
Inventor
In our initial review, we found that the B50 and A50 were performing substantially worse than the A1000. WE have since determined that this was due to a scheduling issue in Inventor/Windows, where the system was sending work to the iGPU rather than the discrete Intel graphics card. We would recommend that users with a Ryzen iGPU and this GPU ensure that work is being properly scheduled.
Image
The other Autodesk software we tested was Inventor, using the InvMark benchmark by the Cadac Group and Tech3D. We are still exploring which subscores to highlight for different categories of components, but we settled on just the Graphics score (chart #2) for this article due to inconsistencies in some of the other scores. We found that the B50 was only a smidge slower than the A1000 due to nearly 35% generation uplift. This is a solid improvement and, combined with the lower price and better VRAM capacity, makes the B50 a compelling option for this application.
SOLIDWORKS
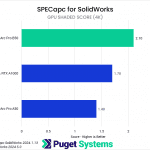
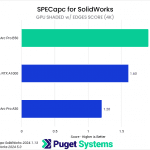
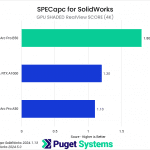
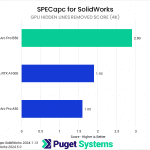
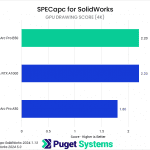
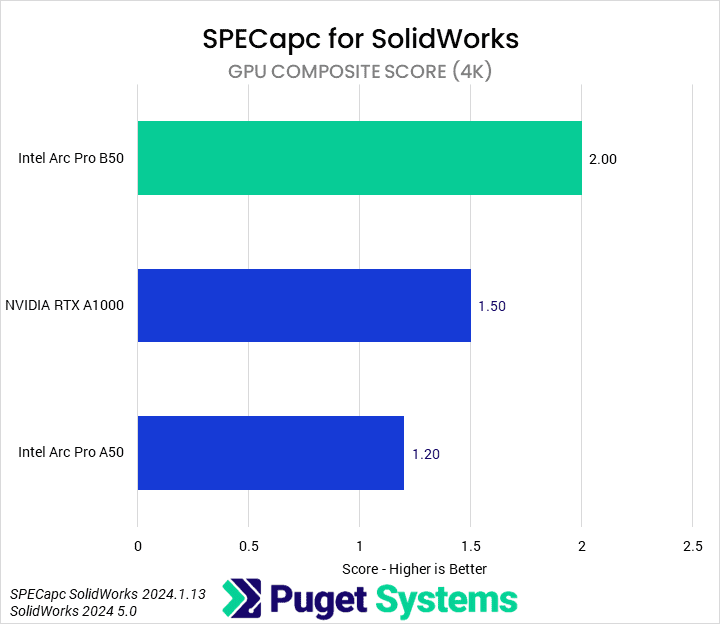

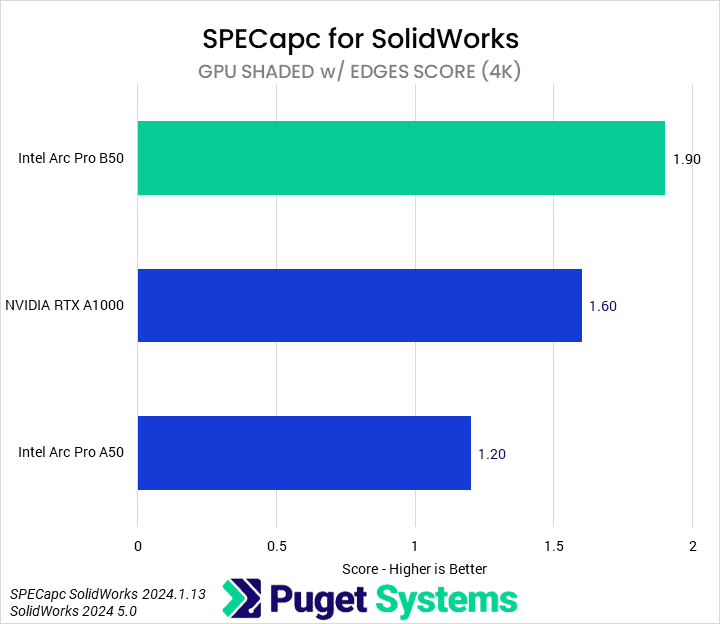
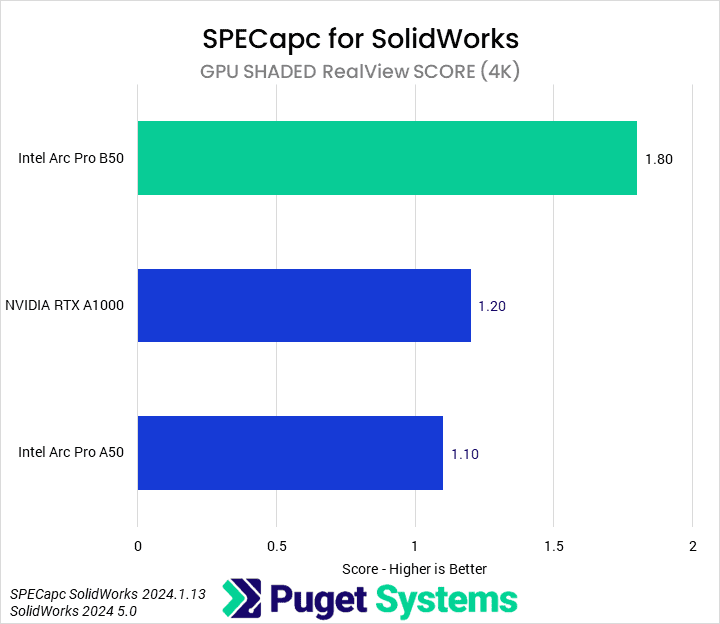
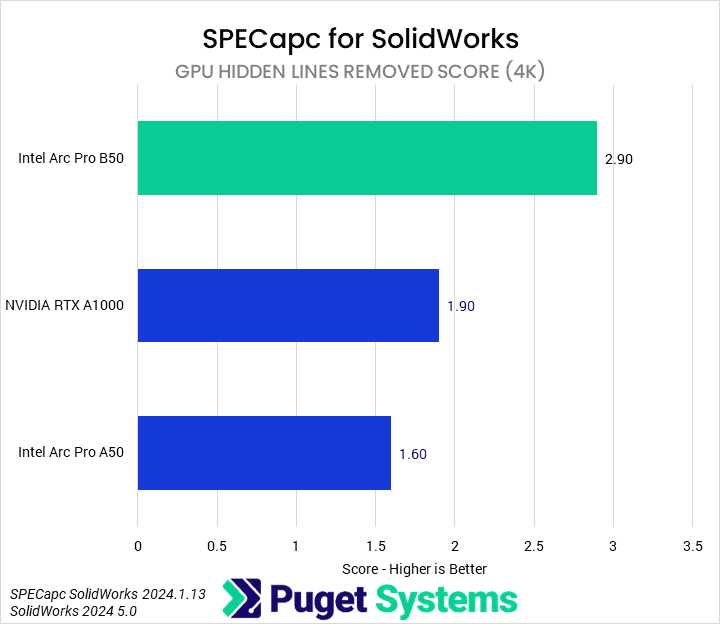
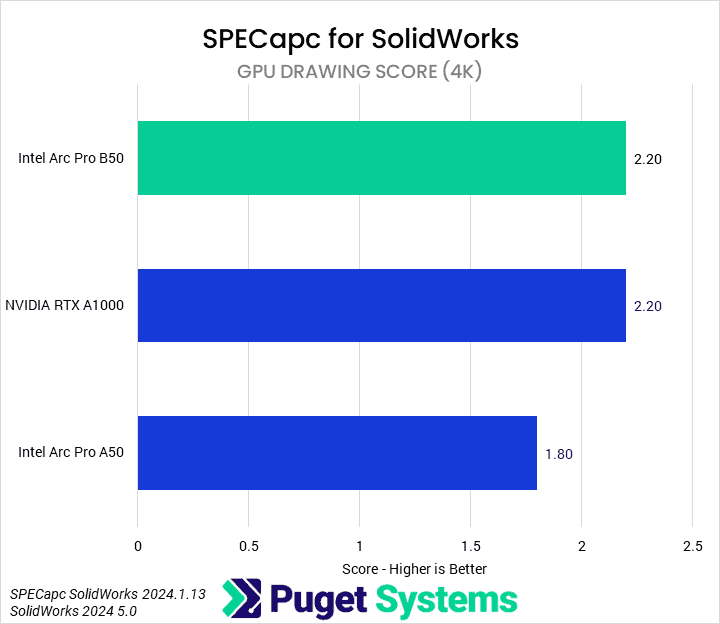
Our final piece of software was SOLIDWORKS, using SPECapc’s benchmark. We’ve reported all of the GPU subscores, but are only focusing on the composite score (chart #1). In SOLIDWORKS, the B50 performs well, with a 33% performance advantage over the A1000 and 66% gain over the A50. Though there is some variance among the subscores (charts #2-7), like the identical GPU drawing scores for the B50 and A1000, these performance deltas hold relatively constant.
How Does the Intel Arc Pro B50 Perform in Professional Applications?
The Intel Arc Pro B50 is an impressive little GPU. We found it to perform very well across a wide variety of benchmarks, especially when compared to the more expensive RTX A1000. Additionally, it comes equipped with 16 GB of VRAM, ensuring it has enough of a frame buffer to take on any task its computing capabilities can handle. We can’t say the same of its competition.
In media and entertainment workflows, the Arc Pro B50 offered modest performance improvements over the NVIDIA card. The B50 was 7% faster than the A1000 in Photoshop, 10% faster in Premiere Pro, and 4% faster in After Effects. However, in each of these applications, it had an area where it was at least 30% faster than the A1000.
In Blender, the B50 outperformed the A1000 by 20%, marking a 135% generational improvement over the A50. This is particularly impressive, as rendering is usually an area of strength for NVIDIA.
The B50 also managed to perform very well in MLPerf, with half the time to first token and 68% more tokens per second compared to the A1000.
However, it did less well in the CAD and BIM benchmarks. The B50 fell behind the A1000 by 20% in Revit graphics tests and 16% in Inventor. In the Inventor graphics score, the A1000 was four times faster. This wasn’t always the case, though. In SOLIDWORKS, the B50 outperformed the A1000 by 33%.
Overall, we were very impressed with the B50. It is a compact GPU with a low power draw that operates nearly silently. It also offers great value with its combination of price, performance, and specifications. There are definitely still some areas where the NVIDIA CUDA advantage will outshine it, but we think that it is a compelling option for entry-level professional workstations.
Looking for a professional workstation?
We build computers tailor-made for your workflow.
Don’t know where to start?
We can help!
Get in touch with one of our technical consultants today.