Table of Contents
Introduction
Just under one year ago, AMD launched the highly acclaimed Ryzen™ 9000 processors, based on its Zen 5 architecture. Although at the time we found middling generational performance improvements, various microcode, firmware, and OS updates have turned them into great products. Now, hot on the heels of the workstation processors, AMD has released the Zen 5 variants of its popular HEDT (High-End Desktop) processors: the AMD Ryzen™ Threadripper™ 9000 series.
Since the success of AMD’s Threadripper™ 3000 processors and Intel’s abandonment of its Core™ X-series processors years ago, AMD has largely owned the High-End Desktop market. We have been continually impressed with AMD’s offerings, but we cannot help but hope Intel will return competition to this space in the future.

Image
Much like the Ryzen 9000 desktop processors, the Threadripper 9000 processors are based on AMD’s Zen 5 microarchitecture. We’re not going to get into the full details of all that that entails, but some top-level highlights are improved L1 and L2 data cache bandwidths (important for HPC workloads), support for true AVX-512 calculations, and overall higher IPC (instructions per cycle). We recommend interested readers check out Chips and Cheese’s article on the topic if they want to dive into the specifics.
AMD has also maintained socket compatibility with this generation of Threadripper processors, using the same sTR5 socket as Threadripper 7000. Existing TRX50 boards are fully compatible with a BIOS update. Due to this, we will consider these CPUs not only as a new build or full platform upgrade but also as drop-in replacements for an existing system.
One reason you may not want to do only a CPU upgrade, however, is that the new Threadripper 9000 processors support faster memory than Threadripper 7000. Specifically, they support up to DDR5-6400, rather than the previous DDR5-5200. Although we plan to investigate memory scaling on Threadripper in the future, preliminary findings suggest performance improvements of 5-10% in many workloads.
Specifications
Below, we have listed the most relevant CPU specifications from AMD and Intel. For more information, visit Intel Ark or AMD’s Threadripper page.
The Threadripper 9000 processors appear to be an iterative improvement over the last-gen Threadripper 7000 processors. Mainline specifications are nearly identical, with the same core counts, cache setup, PCIe lanes, TDP, and base clock. The only top-level differences are the maximum boost clocks, which saw an increase of a few hundred megahertz at the top end, and the maximum supported RAM speed, which increased from 5200 to 6400 Mbps for the whole family.
Of course, as we discussed briefly above, there are a lot of “under the hood” changes that aren’t reflected here. Luckily, unlike the workstation-class Threadripper PRO 9000WX family that was released a week ago, there is no price bump for these HEDT processors.
Comparing AMD’s Threadripper processors to Intel® Xeon® Workstation processors is difficult. AMD uses a traditional core-scaling schema with processors containing 16, 24, 32, 64, and 96. Intel, on the other hand, has unusual core counts at 20, 24, 44, and 60. Also, although Intel tends to be cheaper core-for-core than Threadripper PRO, the Xeon W-3500 family is still priced well above Threadripper 9000. Therefore, in this review, we are only looking at the highest-end W-2500 processor: the w7-2595X. Luckily, if you want comparisons for the rest of Intel’s Xeon W line, all the results are directly comparable between this article and our Threadripper PRO 9000WX review.
Test Setup
AMD TRX50 Test Platforms
| CPUs: AMD Ryzen™ Threadripper™ 9980X AMD Ryzen™ Threadripper™ 9970X AMD Ryzen™ Threadripper™ 9960X AMD Ryzen™ Threadripper™ 7980X AMD Ryzen™ Threadripper™ 7970X AMD Ryzen™ Threadripper™ 7960X |
| RAM: TR 9000: 4x DDR5-6400 ECC Reg. 32GB (128 GB total) Running at 6400 Mbps TR 7000: 4x DDR5-5600 ECC Reg. 32GB (128 GB total) Running at 5200 Mbps |
| CPU Cooler: Asetek 836S-M1A 360mm |
| Motherboard: ASUS Pro WS TRX50-SAGE BIOS version: 1106 |
| GPU: NVIDIA GeForce RTX™ 5080 Driver 576.80 |
| Storage: Samsung 980 Pro 2TB |
| PSU: EVGA SuperNOVA 1200W P2 |
| OS: Windows 11 Pro 64-bit (26100) Balanced Power Profile |
AMD TRX40 Test Platform
| CPUs: AMD Ryzen™ Threadripper™ 3990X AMD Ryzen™ Threadripper™ 3970X AMD Ryzen™ Threadripper™ 3960X |
| RAM: 8x DDR4-3200 ECC Reg. 16GB (128 GB total) |
| CPU Cooler: Noctua NH-U12S TR4-SP3 |
| Motherboard: TRX40 Aorus Pro WiFi BIOS version: F7d |
| GPU: NVIDIA GeForce RTX™ 5080 Driver 576.80 |
| Storage: Samsung 980 Pro 2TB |
| PSU: Super Flower LEADEX VII Gold 1300W |
| OS: Windows 11 Pro 64-bit (26100) Balanced Power Profile |
Intel Xeon Test Platform
| CPUs: Intel® Xeon® w7-2595X |
| RAM: 4x DDR5-4800 16GB (64 GB total) |
| CPU Cooler: Noctua NH-U14S DX-4677 |
| Motherboard: ASUS Pro WS W790E-SAGE SE BIOS version: 1502 |
| GPU: NVIDIA GeForce RTX™ 5080 Driver 576.80 |
| Storage: Kingston KC3000 2TB |
| PSU: Super Flower LEADEX Platinum 1600W |
| OS: Windows 11 Pro 64-bit (26100) High-Performance Power Profile |
Intel Core Ultra Test Platform
| CPUs: Intel® Core™ Ultra 9 285K |
| RAM: 2x DDR5-6400 24GB (48 GB total) |
| CPU Cooler: Noctua NH-U12A |
| Motherboard: ASUS ProArt Z890 Creator WiFi BIOS version: 1901 |
| GPU: NVIDIA GeForce RTX™ 5080 Driver 576.80 |
| Storage: Samsung 980 Pro 2TB |
| PSU: EVGA SuperNOVA 1200W P2 |
| OS: Windows 11 Pro 64-bit (26100) Balanced Power Profile |
AMD Ryzen Test Platform
| CPUs: AMD Ryzen™ 9 9950X3D |
| RAM: 2x DDR5-5600 32GB (64 GB total) |
| CPU Cooler: Noctua NH-U12A |
| Motherboard: ASUS ProArt X670E Creator WiFi BIOS version: 3112 |
| GPU: NVIDIA GeForce RTX™ 5080 Driver 576.80 |
| Storage: Samsung 980 Pro 2TB |
| PSU: EVGA SuperNOVA 1200W P2 |
| OS: Windows 11 Pro 64-bit (26100) Balanced Power Profile |
Benchmark Software
| Adobe Photoshop 26.8 – PugetBench for Photoshop 1.0.5 |
| Adobe Premiere Pro 25.2.3 – PugetBench for Premiere Pro 1.1.1 |
| Adobe After Effects 25.3.1 – PugetBench for After Effects 1.0 |
| DaVinci Resolve 20.0.1.6– PugetBench for DaVinci Resolve 1.2.0 |
| Blender 4.4.0 |
| V-Ray 6.00.01 |
| Cinebench 2024 |
| Unreal Engine 5.5 |
| Visual Studio 2022 |
| Llama.cpp 5122 Phi-3 Mini Q4 |
In order to try to keep our results as comparable as possible, we standardize on a base setup on all of our testbeds, which closely aligns with the content creation workstation specs we recommend. As part of this, we keep our memory running at the officially supported JEDEC RAM speeds, disable overclocking features, and enforce power limits; the Xeon processor was run with PL1 = TDP, PL2 = 1.2*TDP, and Tau = 32 s.
However, this sometimes means more differences between our test platforms than we would prefer. For example, in this article, the RAM is not identical across platforms. Each product family we tested supports a different maximum memory frequency. There is also some variance in RAM capacity, though all systems have sufficient RAM for our benchmark suite. While this does make it more difficult to tease out what performance gain is due to memory and what is due to the CPU itself, ultimately, what matters is the holistic performance of the system rather than the contribution of any individual component.
The coolers also vary. Due to thermal considerations, we have decided that the TRX50 and WRX90 systems we sell should be configured with an all-in-one liquid cooler (AIO) by default, so we have tested with one here. When testing, we did not have compatible AIOs for our W790 system, so we used our standard Noctua air coolers for that platform. Our desktop platforms also remain on the highly-performant Noctua NH-U12A coolers. Based on our testing, not using an AIO for Intel Xeon W should not impact our performance comparisons to a significant degree.
Finally, the Intel Xeon W processor was tested with the “High Performance” power plan due to our initial review findings, which saw a 20% performance loss from the “Balanced” power plan. We have not observed this behavior with any of the other CPUs in this review (updates since the launch of the 285K have rectified this behavior), so they remain on our default “Balanced” power profile.
On the software side, we are using many of our PugetBench benchmarks, some of which were also used by AMD as part of the official AMD Ryzen Threadripper 9000 Series introduction. We supplement them with several other real-world benchmarks, primarily rendering packages like Blender and V-Ray.
Looking for a Content Creation Workstation?
We build computers tailor-made for your workflow.
Don’t know where to start?
We can help!
Get in touch with our technical consultants today.
Results Tables
We choose our benchmarks to cover many workflows and tasks to provide a balanced look at the application and its hardware interactions. However, many users have more specialized workflows. Recognizing this, we like to provide individual results for benchmarks as well. If a specific area in an application comprises most of your work, examining those results will give a more accurate understanding of the performance disparities between components. Otherwise, we recommend skipping over this section and focusing on our more in-depth analysis in the following sections.
Unreal Engine results are coming soon; we are holding off on uploading the raw results until we have further investigated the performance issues we found in this round of testing.
Graphic Design: Adobe Photoshop
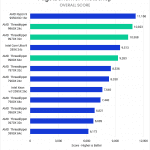
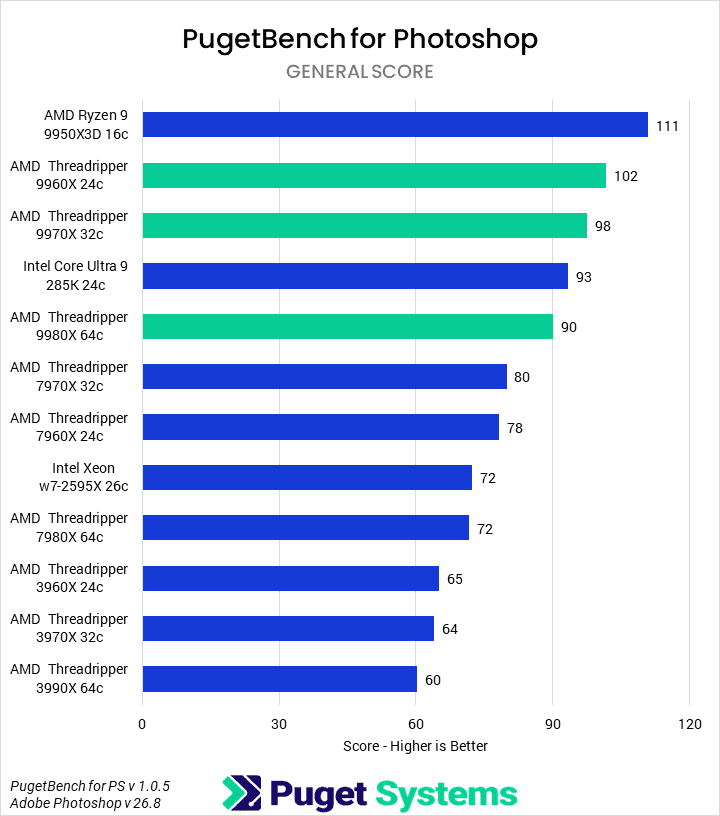
In Adobe Photoshop, we see the perfect example of why we included desktop processors alongside the HEDT parts. Looking at the Overall score (Chart #1), the AMD Ryzen 9950X3D was the fastest CPU we tested and is far cheaper than any of the Threadripper processors. However, the new Threadripper 9000 CPUs are still very good. They average 20-30% performance gains over their Threadripper 7000 counterparts, with the 9960X performing particularly well, only 3% behind the 9950X3D. Embarassingly for Intel, it is also 42% faster than the Intel Xeon W7-2595X. Even more impressive is the skip-generation performance, where we see uplifts of up to 50-60% compared to the Threadripper 3000 series.
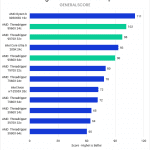
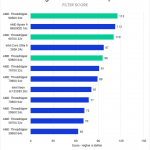
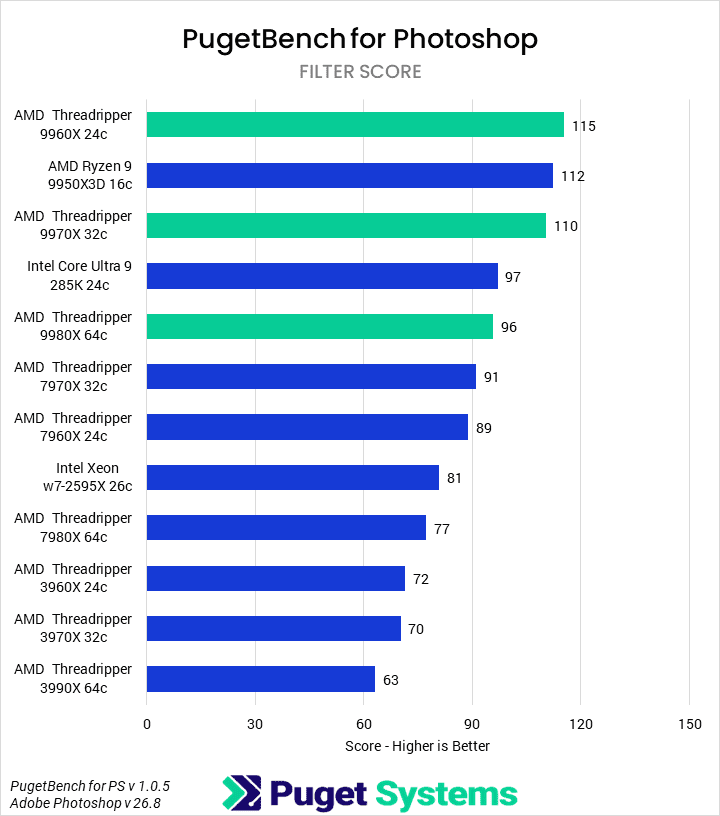
Unsurprisingly, the subscores are fairly similar. Our “General” score (Chart #2) has the same rankings and similar performance differences. However, we do see a slight shuffle in the Filter score (Chart #3), with the 9960X swapping positions with the 9950X3D.
Overall, we wouldn’t recommend a Threadripper processor for pure Photoshop workflows. A desktop Ryzen CPU like the 9950X3D (or, based on past testing, the 9700X) will perform better for far less money. However, you do get impressive performance from the new Threadripper 9000 series if you use Photoshop as a secondary application alongside others that take more advantage of higher core count processors.
Video Editing: Adobe Premiere Pro
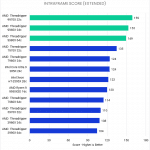
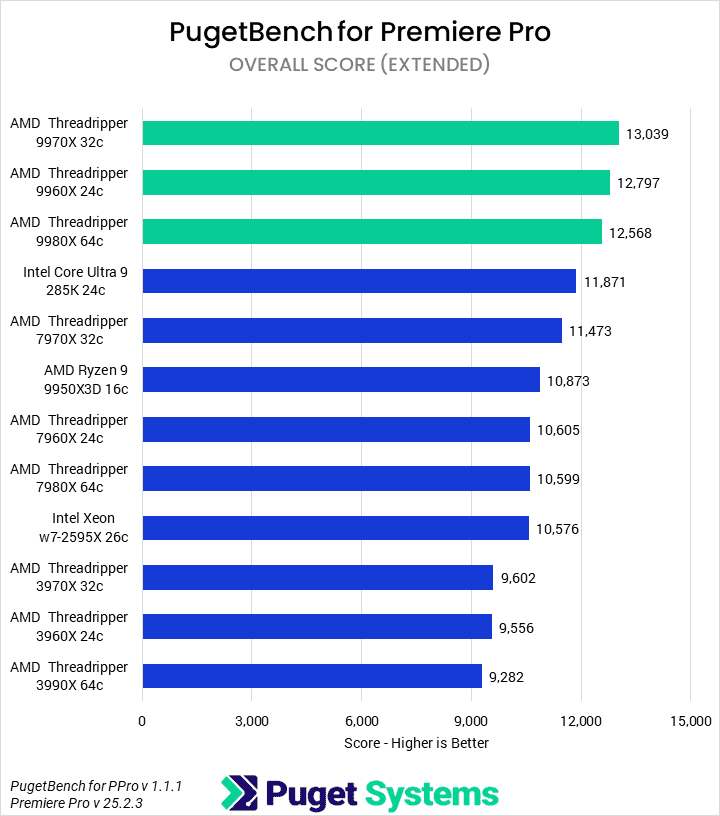

The next benchmark we ran was PugetBench for Premiere Pro. Unlike Photoshop, Premiere Pro has an extensive set of workflows we test, from different media types to GPU effects. Each of these has different hardware demands and preferences. Following on from our Threadripper PRO 9000WX article, we are particularly interested in seeing how the 9950X3D and 285K compare in this application.
Starting with the Overall score (Chart #1), we see that AMD’s new Threadripper 9000 processors are the three fastest tested CPUs. The 9970X leads the pack, 2% ahead of the 9960X and 4% ahead of the 9980X. All of these are effectively within the margin of error. This results in gen-on-gen improvements of 14%, 21%, and 19% respectively. The next CPU is the 285K, 6% slower than the 9980X and 9% faster than the 9950X3D—Intel’s Xeon w7-2595X trails, 21% slower than the 9960X.
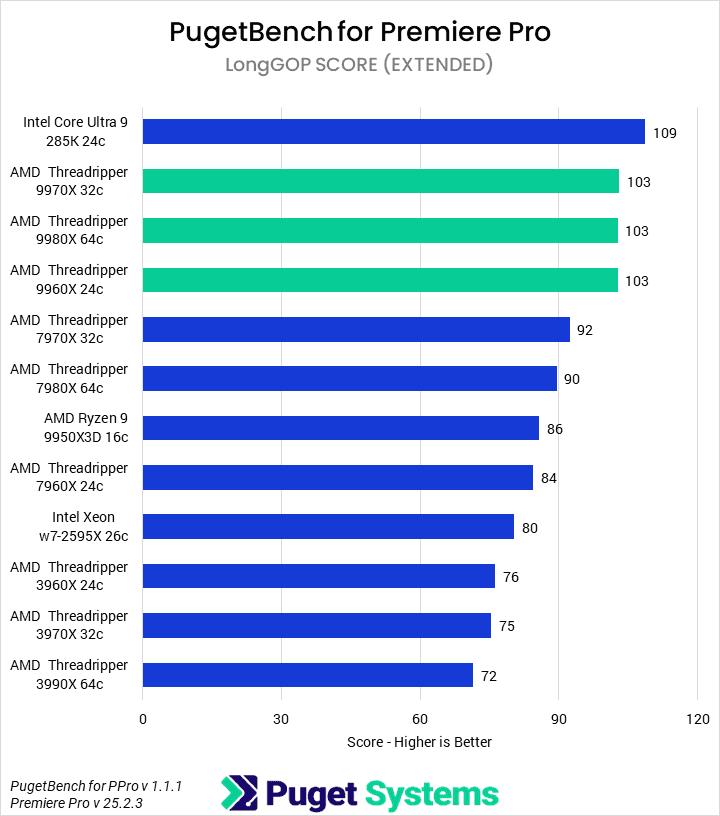
Moving on to codec-specific tests, the first variety we look at are LongGOP flavors, including H.64 8-bit 4:2:0, HEVC 8bit 4:2:0, and HEVC 10-bit 4:2:2. This does lead to a quirk where, due to running a slightly older version of Premiere Pro, not all of the new NVIDIA Blackwell media encoder features are supported; Intel thus has an advantage that may not bear out in the real world. However, we also currently test software encoding for those variants, so the results tend to be biased towards higher core-count processors. We have a benchmark update in the works to support newer versions of Premiere Pro, but work on that has been slowed due to Adobe removing support for exporting to HEVC via scripting.
Nonetheless, Intel’s 285K leads in LongGOP codecs (Chart #2), scoring 109. The three new AMD processors follow behind with scores of 103, representing leads of 12-22% over the Threadripper 7000 parts. As noted above, we expect that for users on Blackwell GPUs using Premiere Pro version 25.3 or newer, all of these CPUs should perform nearly identically for supported media types.
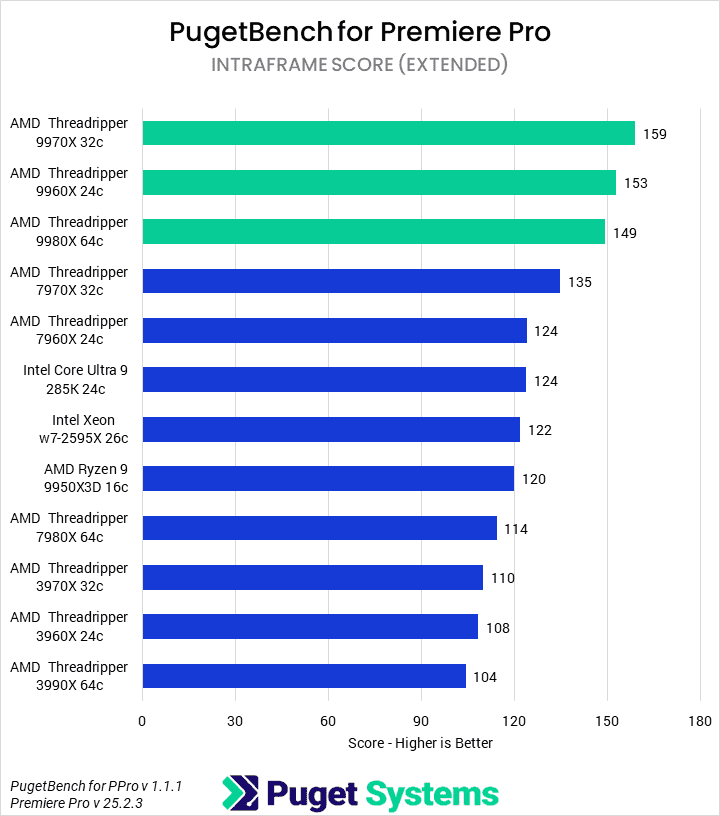
Unlike LongGOP codecs, Intraframe codecs (Chart #3) are unaccelerated (save for ProRes on some Apple computers). This makes them particularly sensitive to highly-performant CPUs. We see this borne out in the data. The 9970X is the fastest CPU, with an 18% performance advantage over the 7970X and 4% lead over the 9960X. The 9960X is 23% faster than the 7960X and 3% ahead of the 9980X. The 9980X outperforms the 7980X by 31%. The desktop processors fare less well here, with the 285K matching the 7960X and 9950X a few points behind that. Most Intraframe codecs are light enough that this represents acceptable performance from any of the tested CPUs, but the improvements are impressive—especially from the 64-core monster.
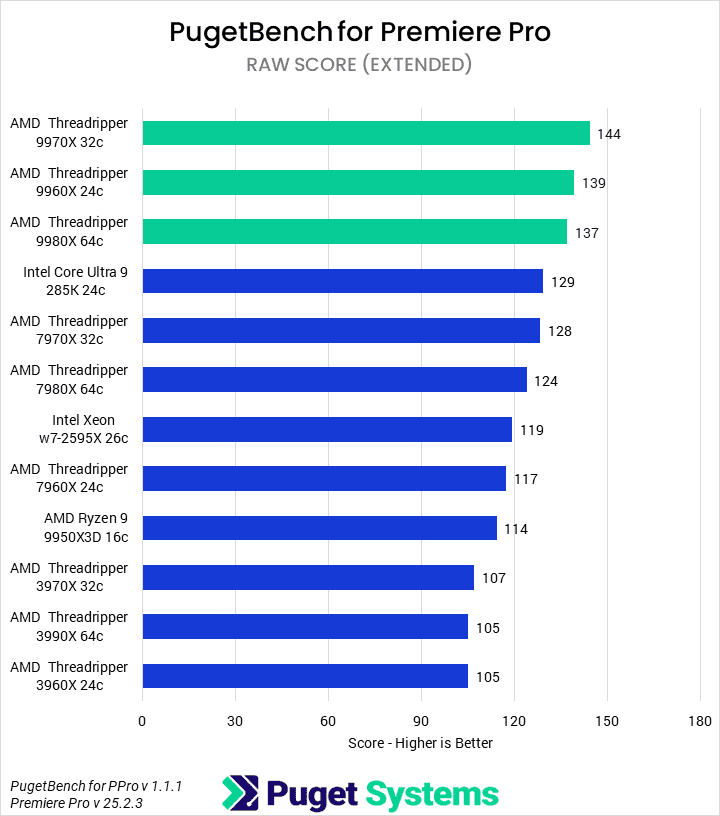
RAW codecs (Chart #4) tend to rely more on raw CPU and GPU horsepower, as they are heavier on the system and don’t have dedicated acceleration hardware. This means that performance in these codecs is usually more meaningful than in Intraframe codecs. We found that the 9970X was once again the fastest CPU, followed by the 9960X (4%), 9980X (5%), and 285K (12%). The generational improvements over Threadripper 7000 are between 10% to 18%, and 30% to 37% over Threadripper 3000.
Finally, we have the GPU Effects subscore (Chart #5). Typically, this relies primarily on the GPU (as the name suggests), but CPU performance has an impact. As you would expect, we don’t see as much variation here, with all three TR 9000 processors, the 9950X3D, and the 285K all within the margin of error. Only when you drop to the 7970X and below do we start seeing any actual difference, and even then, it isn’t huge: gen-on-gen improvements are sub-20%.
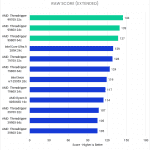
Motion Graphics: Adobe After Effects
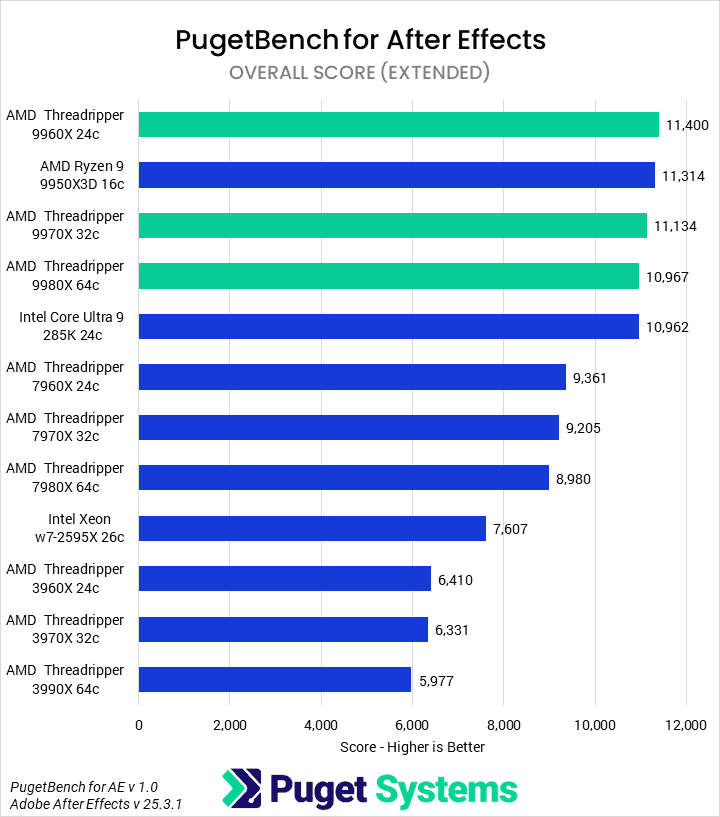
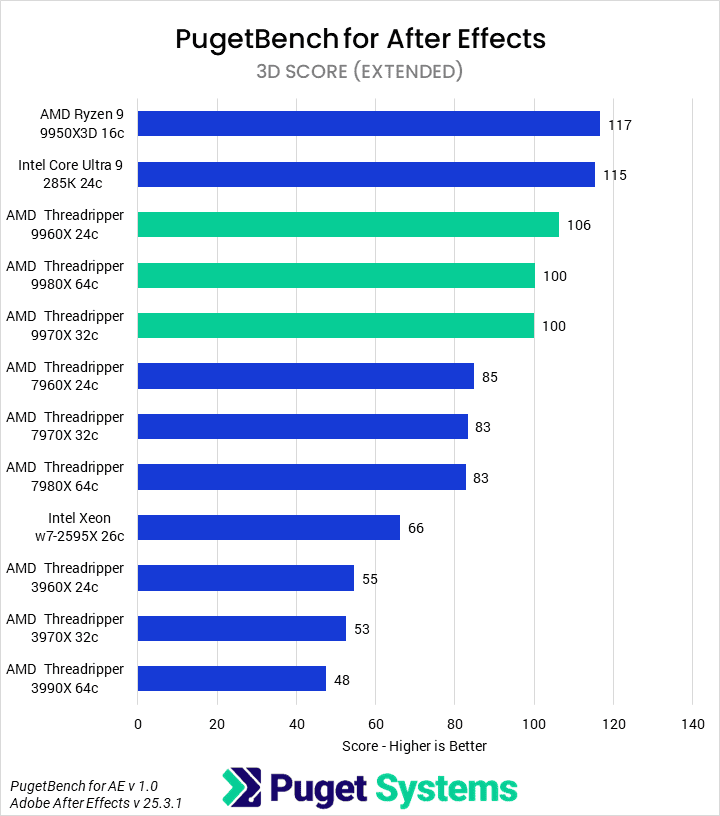
After Effects, as an application, has a healthy mix of single-threaded and multi-threaded workflows. Traditional 2D workflows tend to be CPU-bound, and especially with the MFR feature, can take advantage of multiple cores. 3D workflows depend primarily on the GPU but, alongside Tracking workflows, prefer high single-core performance.
Starting with the Overall score (Chart #1), AMD’s 9960X and 9950X3D are essentially tied. The 9970X and 9980X follow closely behind, with the latter effectively tying the 285K again. However, after this, we see a large dropoff. The next fastest CPU is the 7960X, 22% slower than the 9960X (17% behind the 285K). The TR 7000 series is again clustered, with, again, a large dropoff to the w7 2595X and then the TR 3000 series.
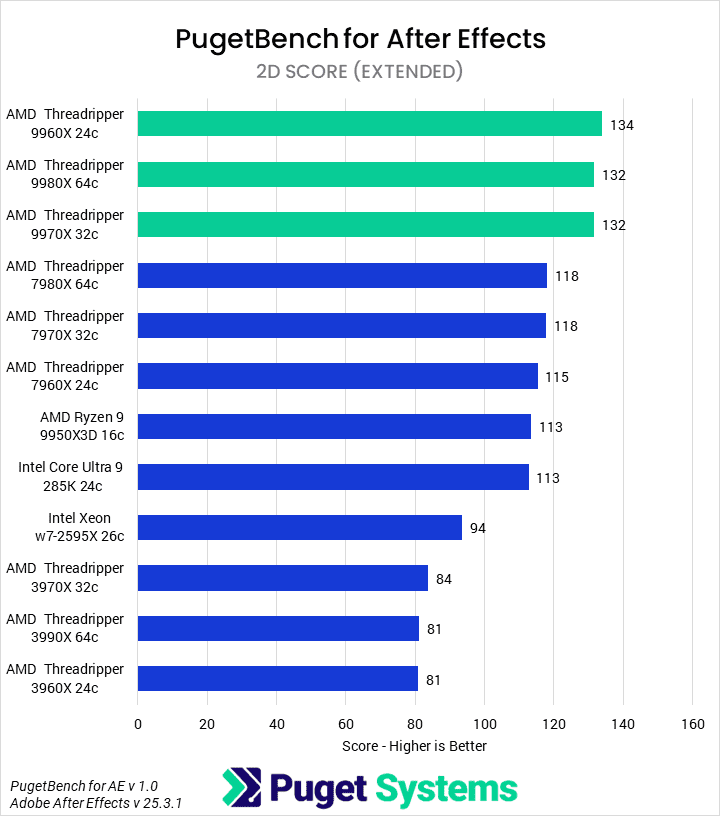
In 2D workflows (Chart #2), the 9960X is the fastest processor, scoring 134. The 9980X and 9970X follow, with each scoring 132. After this, the 7980X and 7970X scored 118 points, resulting in a performance uplift of 12% for their 9000 counterparts. AMD’s 9950X3D and Intel’s 285K also hover around here, with scores of 113 each, 18% slower than the Threadripper 9000 parts. As is tradition, the 2595X only outperforms the six-year-old Threadripper 3000 CPUs.
We’re going to pass over a detailed analysis of 3D workflows (Chart #3)—as those are primarily GPU bottlenecked—save to say that the two tested desktop processors were the fastest by more than 10%, but that the Threadripper 9000 CPUs were very good. Moving on to Tracking (Chart #4), we found that the 9950X3D was the fastest CPU, with a 5% lead over the 9970X. The 9960X saw a 24% performance uplift over the 7960X, and the 9980X a 35% uplift over the 7980X.
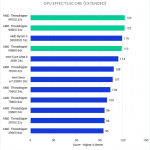
Video Editing / Motion Graphics: DaVinci Resolve Studio
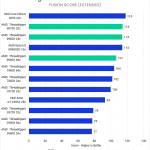
Much like Premiere Pro, DaVinci Resolve is a complicated application that facilitates several distinct workflows. From codec-specific performance tasks to GPU Effects to the in-software motion graphics/VFX engine of Fusion, what hardware is best will depend a lot on the specific use case the end-user is targeting.
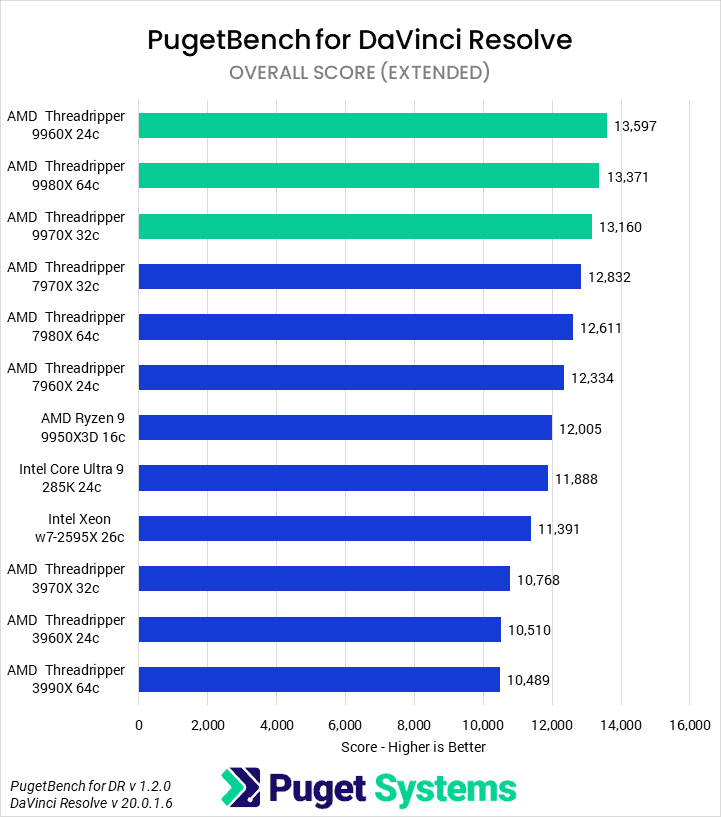
Beginning with the Overall score (Chart #1), things look promising for the new Threadripper 9000 processors. The 9960X tops the chart, followed by the 9980X and 9970X. The generational gains are small, though. The 9960X has the largest at about 10%, but the 9980X is only 6% faster than the 7980X, while the 9970X manages only 3%—smaller than we feel comfortable calling a real-world difference.
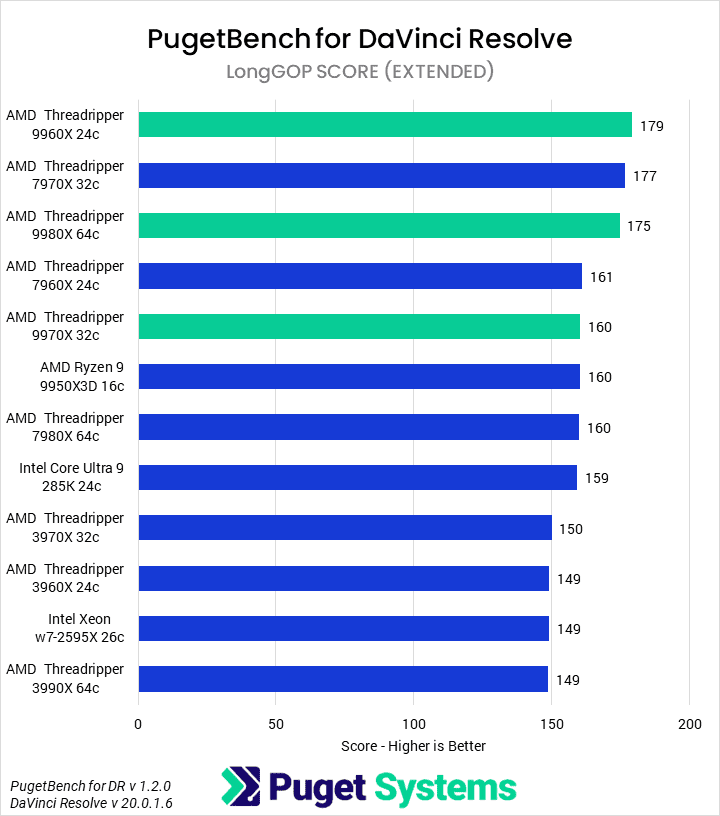
In DaVinci Resolve Studio version 20, Blackwell GPUs are fully supported, so LongGOP scores (Chart #2) are fully accelerated on the GPU. The CPU still has an impact, but it is typically smaller than in some areas. The new 9000 Series does seem to improve performance a bit here as compared to a desktop processor or last-gen Threadripper, but ultimately, the GPU matters far more than any processor.
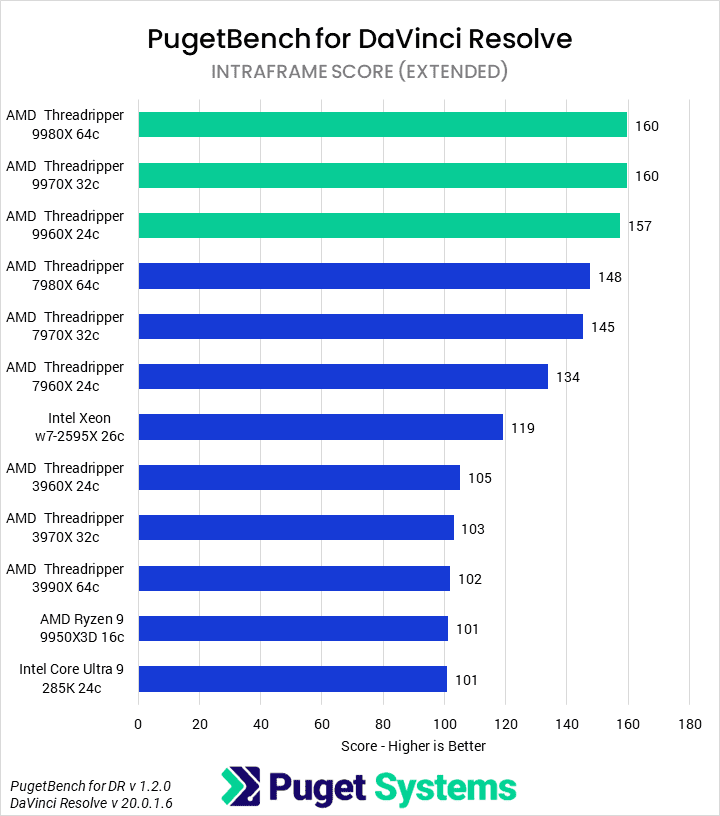
Moving on to our Intraframe tests (Chart #3), the 9980X performs very well, with a 16% gen-on-gen performance increase over the 7980X. Right behind it are the 9960X and 9970X, with 17% and 7% uplifts, respectively. This is an area where the desktop parts, the 285K and 9950X3D, are relatively slow, tied for the lowest score.
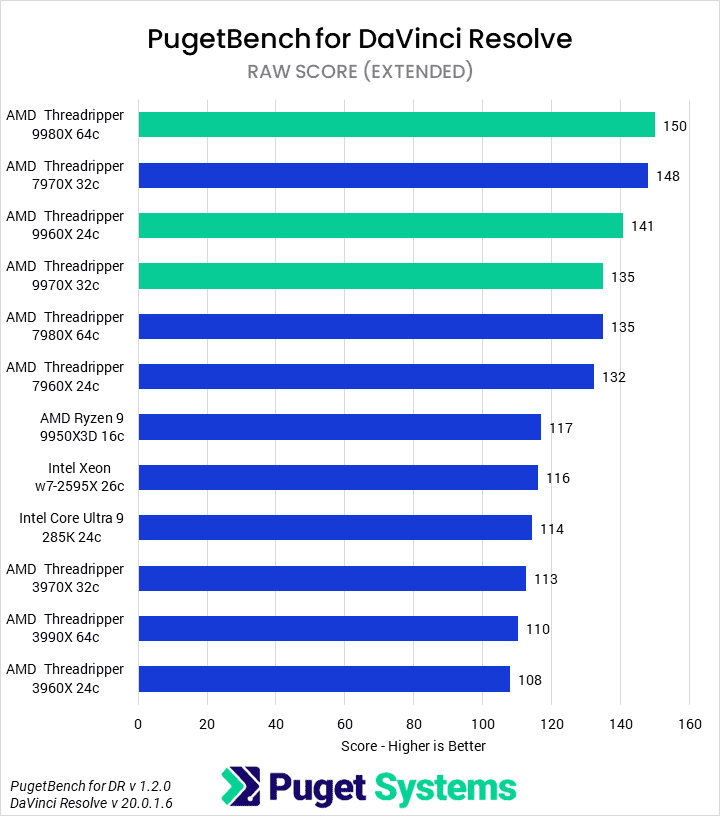
Our final codec-specific tests are the RAW tests (Chart #4). RAW media is typically very heavy on the CPU, and we see that represented here, with the 9980X topping the chart. There isn’t a huge difference between Threadripper 9000 and Threadripper 7000, though, with all of them being within the benchmark’s margin of error.
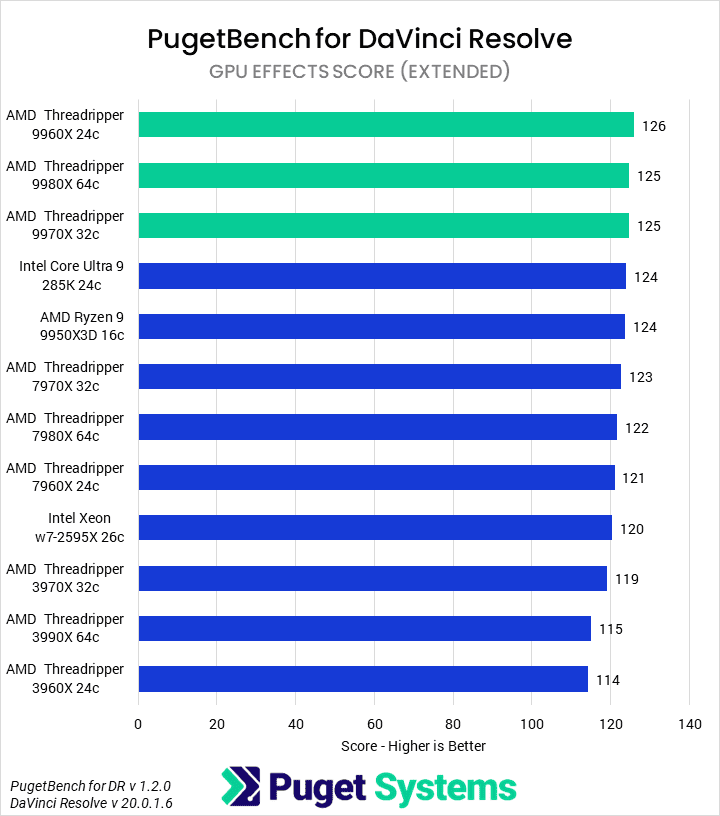
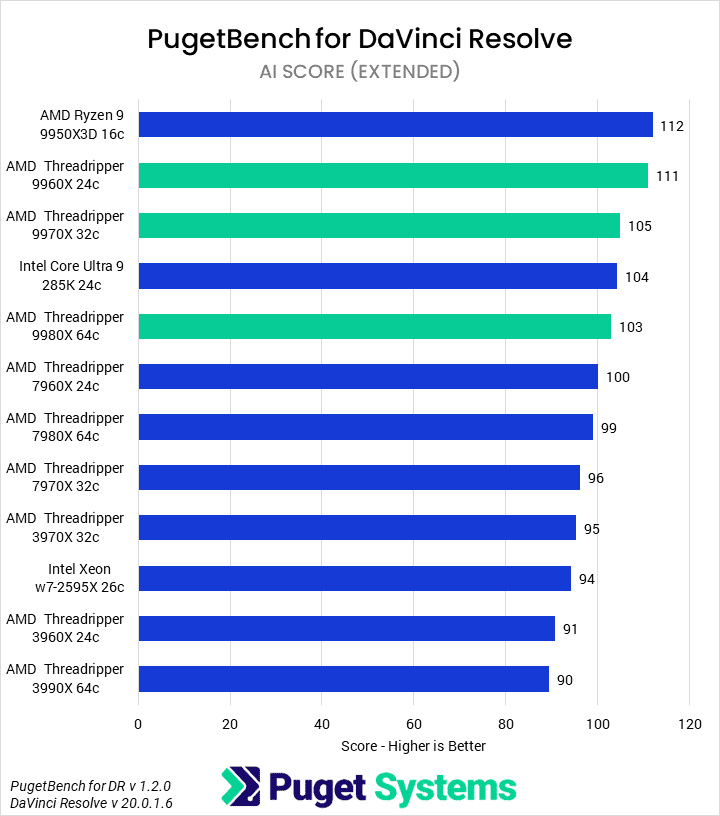
Next up is GPU effects (Chart #5). This is, as the name would suggest, GPU-bound, so the CPU has essentially no impact. The new Threadripper parts do lead the chart, but the fastest CPU is only 10% faster than the slowest CPU, and most are within 5%. We typically expect AI scores (Chart #7) to follow GPU scores relatively closely, and that mostly appears to be the case. Generational improvements are a few percent at most, and some of the lower core-count processors perform slightly better.
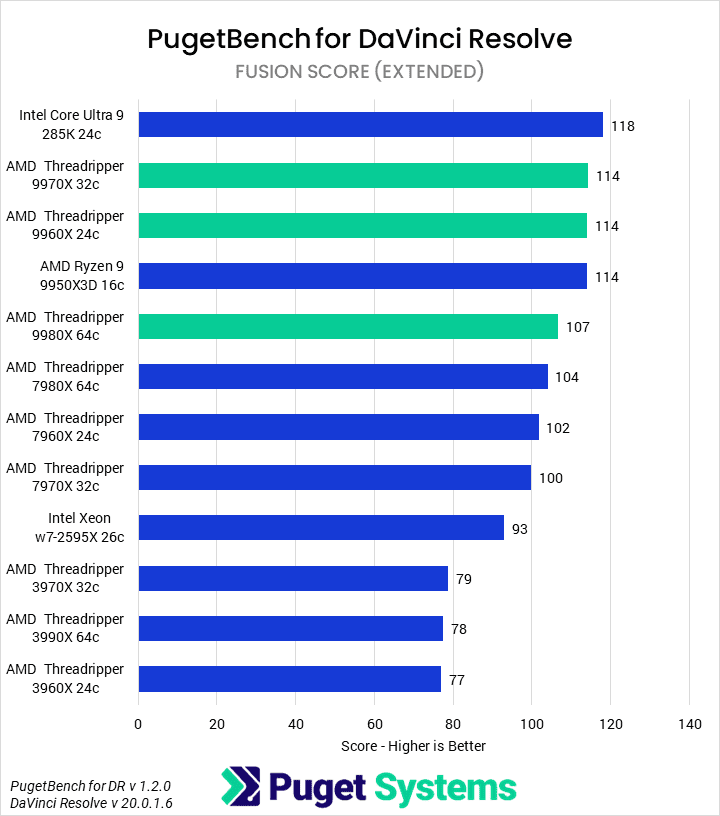
Finally, we have the Fusion workloads within DaVinci Resolve (Chart #6). As expected for primarily lightly-threaded workloads, the 285K takes the top spot, leading the 9960X and 9950X3D by 4%. However, this represents impressive improvements for the Threadripper 9000 parts. The 9960X is 21% faster than the 7960X, while the 9970X and 9980X are about 10% faster than their Threadripper 7000 equivalents. AMD has been getting very good at maintaining single-core performance on high-core count parts.
Game Dev / Coding: Unreal Engine
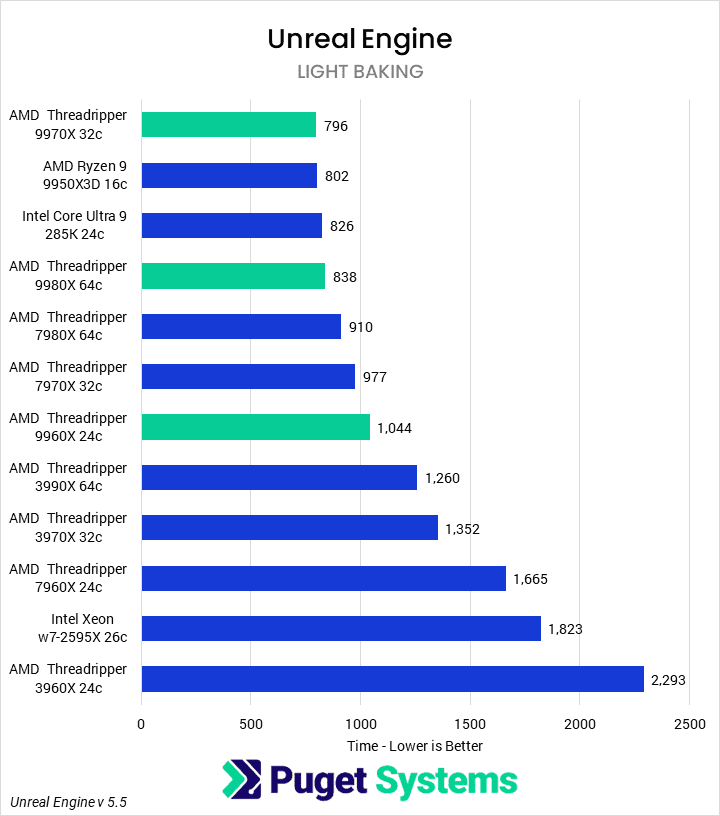
Our Unreal Engine benchmark suite currently consists of three different UE-related tasks: compiling the engine in Visual Studio, compiling shaders for a scene within the engine, and building lighting for a scene. HEDT parts like the Threadripper 9000 processors can potentially make for a great build server for a small-to-medium game dev team or as an individual dev’s workstation.
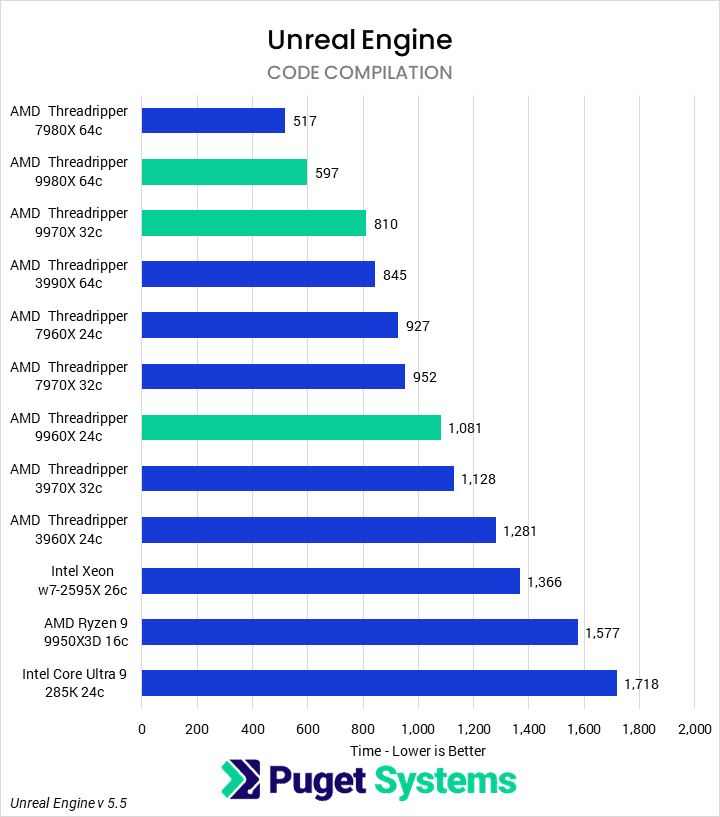
Our first test, compiling Unreal Engine in Visual Studio 2022 (Chart #1), is useful both for game devs and as a proxy for other coding workflows. Here, we see consistent scaling with core count, but less generational improvement than expected. Indeed, in most cases, the 9000 processors are slower than their 7000 equivalents. We’re still investigating why this is the case, but it appears to be a real result with our configuration.
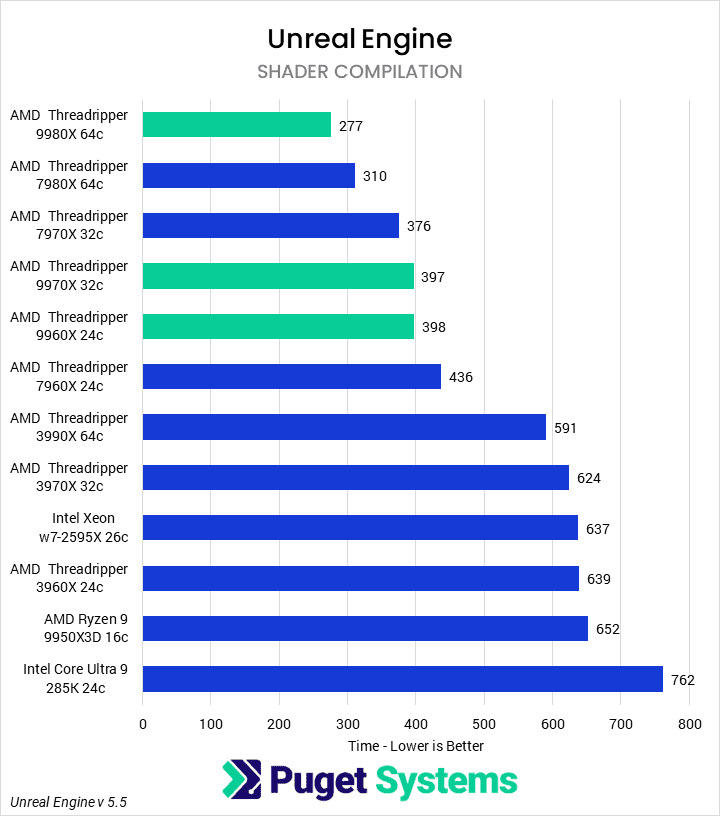
Moving on to shader compilation (Chart #2), we see performance more in line with what we would expect, with the 9980X finishing in 89% of the time of the 9980X. The generational uplift is lower than expected based on our Threadripper PRO 9000WX testing. However, even with that, this is a solid performance improvement, and one we see repeated by the 9960X.
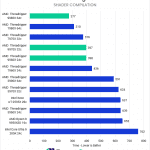
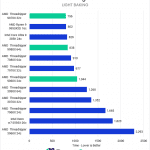
The last test in our Unreal Engine suits is light baking (Chart #3). This test tends to have far more variance than the others, but we still see some light scaling generationally, with the 64- and 32-core parts completing in about 90% the time of their Threadripper 7000 counterparts. The 9960X is particularly impressive comparatively, but we think that is more due to the 7960X just running poorly here.
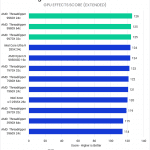
CPU Rendering: Cinebench, Blender, & V-Ray
The most fun set of benchmarks when looking at HEDT and Workstation processors is offline renderers. These tend to be very hungry for cores and scale incredibly well. Alongside the higher core counts, HEDT parts also offer the RAM capacity and connectivity needed for super-performant systems or nodes.
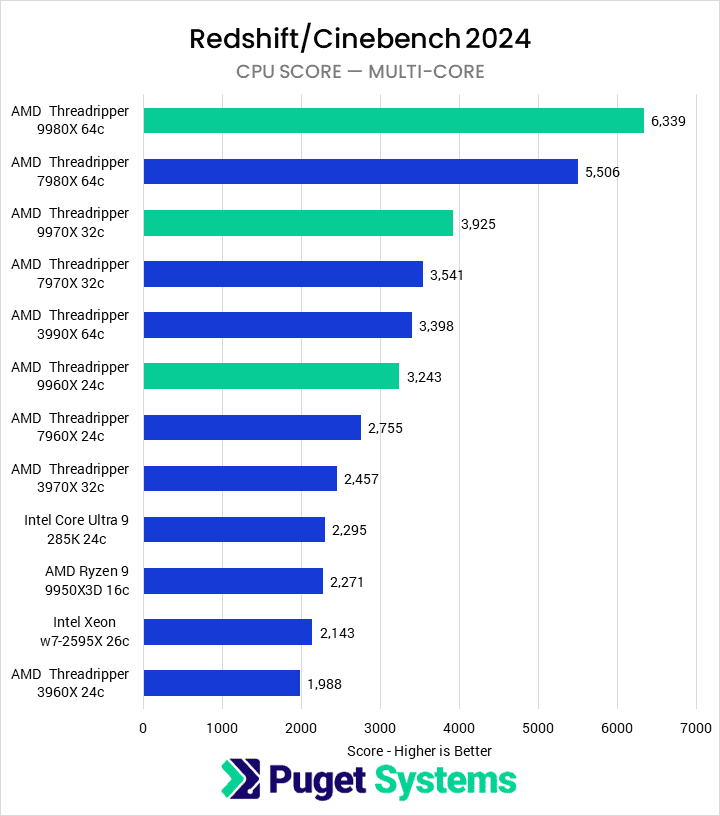
Starting with Cinebench 2024 multi-core (Chart #1), the Threadripper 9000 processors offer 10-18% better performance than their last-gen counterparts. The 9980X leads the pack with a score of 6,339, 15% ahead of the 7980X and 61% faster than the 9970X. The 9970X is 11% faster than the 7970X, 16% faster than the 3990X, and 21% faster than the 9960X. Finally, the 9960X outperforms the 7960X by 18%.
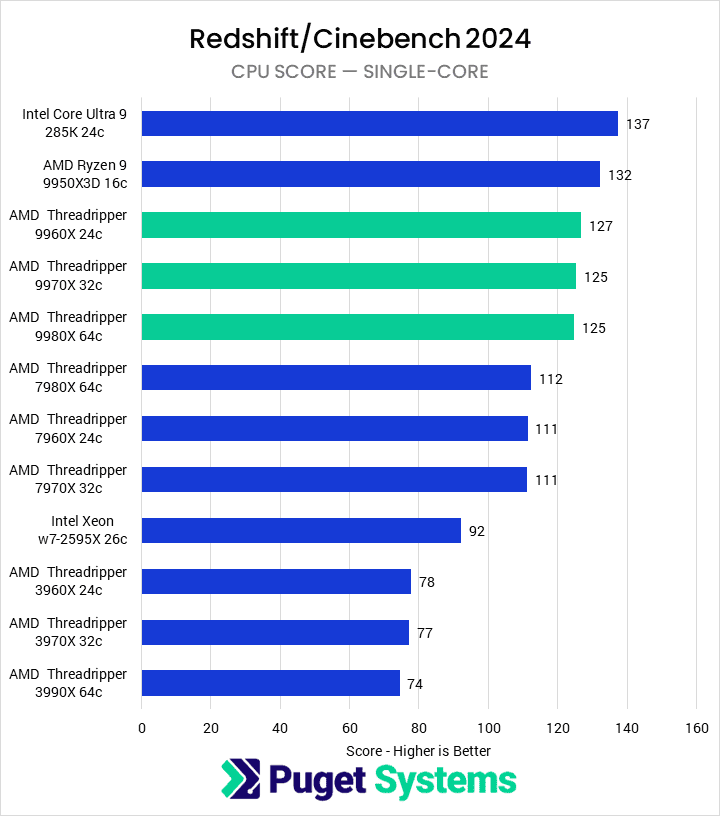
Cinebench 2024 single-core (Chart #2) is a synthetic single-threaded benchmark. The 285K tops the chart, followed closely by the 9950X3D. Impressively, the new Threadripper 9000 processors are just 5% slower than the 9950X3D, making for a 13% generational performance improvement. This also means the 9960X is nearly 40% faster than the 2595X.
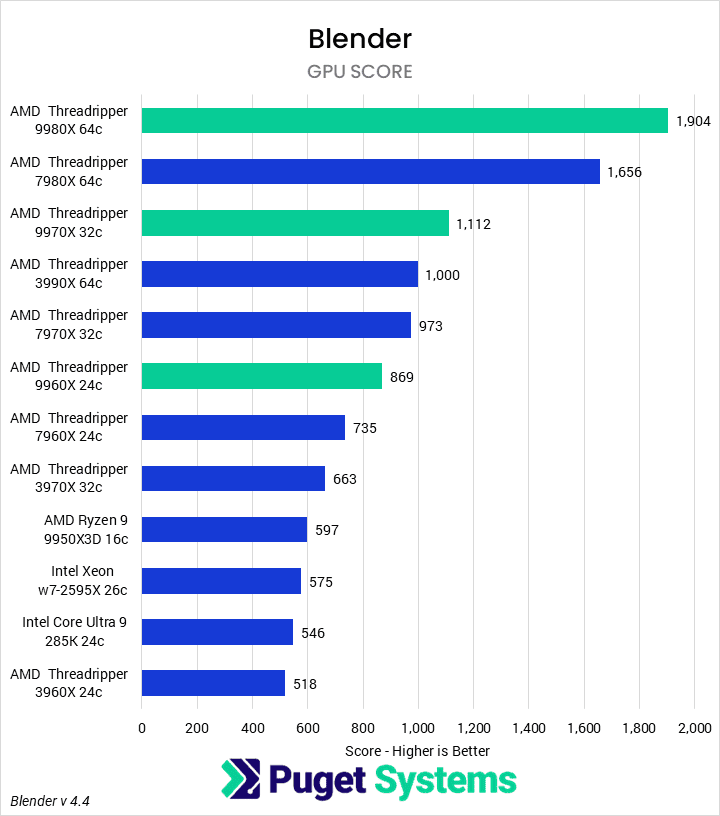
Next up is the Blender Cycles rendering benchmark (Chart #3). Once again, the 9980X is the fastest processor we tested. The 9980X was 15% faster than the 7980X, 71% faster than the 9970X, and 90% faster than the 3990X. The 9970X managed a 14% uplift over the 7970X, while the 9960X was 18% faster than the 7960X and 51% faster than the 2595X.
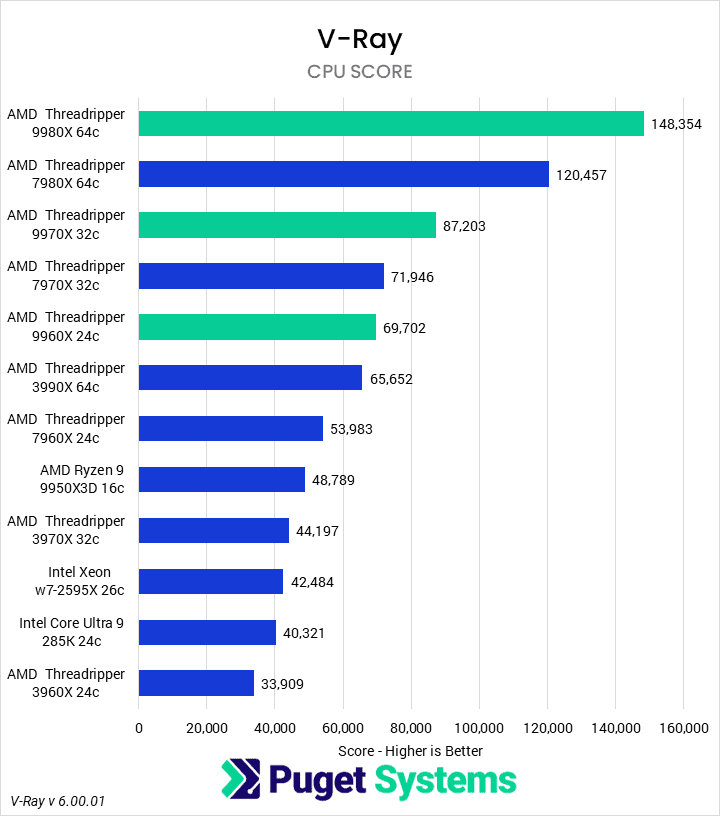
The final offline renderer we test with at present is Chaos’ V-Ray (Chart #4). In the CPU mode tests, the ordering is essentially the same as in Blender and Cinebench. The 9980X is the performance king, beating the 7980X by 23%, the 9970X by 70%, the 7970X by 106%, the 9960X by 113%, and the 2595X by 250%.
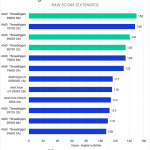
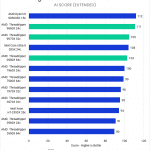
AI: LLM (Llama)
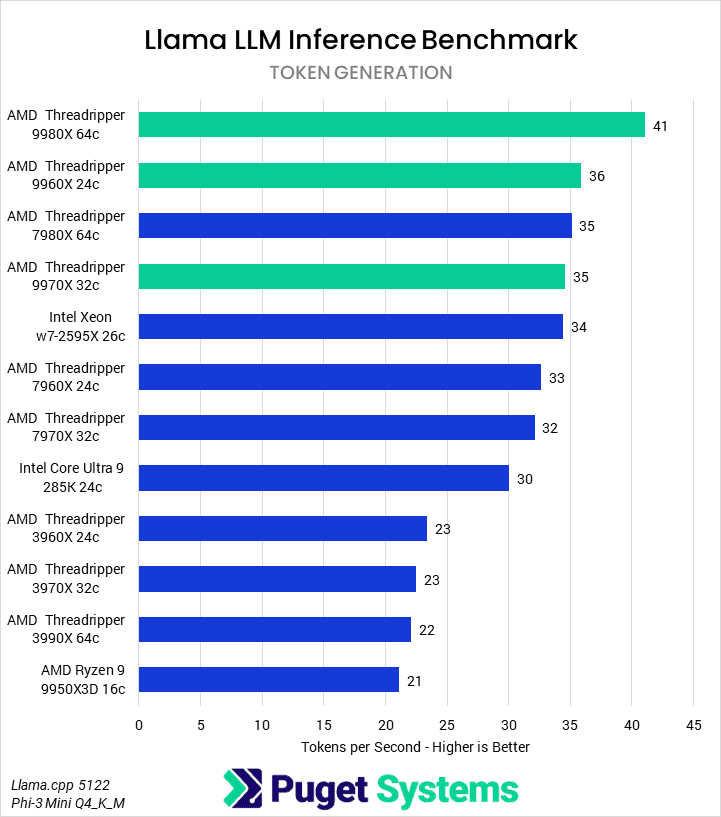
System Image
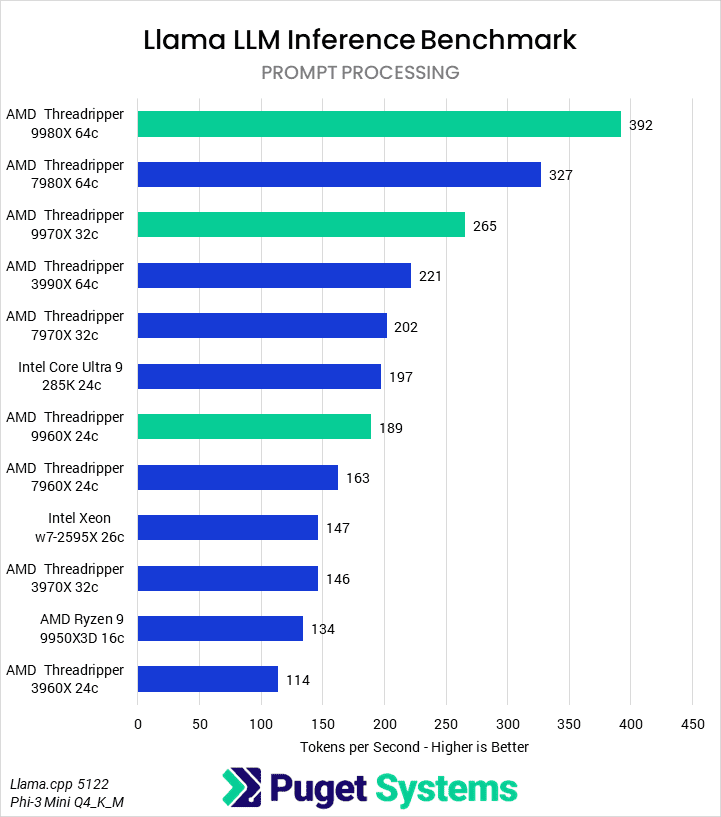
One of the more recent benchmarks we have begun to use is an LLM benchmark based on Llama.cpp, using Phi-3 Mini with 4-bit Quantization. The benchmark looks at the performance in prompt processing and token generation (essentially, the input and output of a user-facing chatbot) using a lightweight model that scales across both CPUs and GPUs.
Starting with prompt processing (Chart #1), we found that the 9980X was the fastest CPU, leading the 7980X by 20% and the 9970X by 48%. The 9970X was 20% faster than the 3990X, 31% faster than the 7970X, and 34% faster than the 285K. Impressively, Intel’s desktop part manages to outperform the 9960X by 4% and the 2595X by 34%. The only disappointing CPU in this testing was the 9960X, which only managed a solid 16% performance uplift, gen-on-gen.
In the token generation portion of the benchmark (Chart #2), we see similar overall trends, but with much more apparent randomness. The 9980X is the fastest, followed by the 9960X and 7980X / 9970X, 14% and 17% slower, respectively. Surprisingly, the 2595X actually does well here, essentially tied with the 9970X. In this portion, generational uplifts are relatively modest, between 8 and 17 percent.
How do the AMD Ryzen Threadripper 9000 CPUs Perform in Content Creation Applications?
We are very impressed by AMD’s latest workstation and HEDT processors. After a slightly disappointing Ryzen 9000 launch on the desktop side, we were prepared for a lackluster generational refresh. However, the combination of scheduling, microcode, and IO improvements have allowed the Zen 5 architecture to shine. We especially appreciate AMD maintaining the socket and pricing of the last-gen Threadripper 7000 series.
In traditional “media and entertainment” workflows with applications like Photoshop, Premiere Pro, After Effects, and DaVinci Resolve Studio, the new Threadripper 9000 CPUs offered good generational improvements. In nearly all those applications, we saw uplifts of 15-30% in CPU-bound scenarios. However, even in traditional GPU workloads, like GPU Effects in Premiere Pro, the 9000 processors increased performance by around 5-10% over the 7000 processors. For some of these workflows, we saw that a 9950X3D or 285K will offer better performance—or at least better performance per dollar—but the new processors are still very impressive. If you need a Threadripper processor for the high RAM capacity, high PCIe lane count, or work with exceptionally heavy projects, they certainly won’t hurt your performance.
For heavily CPU-based applications like CPU Rendering in V-Ray, Blender, or Redshift, or compiling code and scenes for Unreal Engine, the Threadripper 9000 family is even more impressive. The 9980X is the fastest HEDT part ever, outperforming the 7980X by 15-23% and Intel’s top-end 3595X (which we tested in our Threadripper PRO review) by 80% in V-Ray. On the lower-end, the 9960X also performs well, beating Intel’s 2595X by up to 51% in Blender.
We do want to make sure to note that AMD has also recently launched its Threadripper PRO 9000WX series of processors, which offer even higher core counts, memory bandwidth, and PCIe lanes. We have a similar Content Creation Review available for those processors, and in the coming days and weeks, we will be publishing a range of articles examining when you might want to use either of these product families, or when something like the AMD Ryzen or Intel Core family may be a better fit.
Last Edited: 7/31/2025
We updated the article with corrected DaVinci Resolve results for a selection of CPUs, caused by an error with the Resolve software package. We also updated wording in the Unreal Engine section. Previously, we believed the low performance was due to a memory issue, but have since confirmed that is not the case.
If you need a powerful workstation to tackle the applications we’ve tested, the Puget Systems workstations on our solutions page are tailored to excel in various software packages. If you prefer to take a more hands-on approach, our custom configuration page helps you to configure a workstation that matches your exact needs. Otherwise, if you would like more guidance in configuring a workstation that aligns with your unique workflow, our knowledgeable technology consultants are here to lend their expertise.
Looking for a content creation workstation?
We build computers tailor-made for your workflow.
Don’t know where to start?
We can help!
Get in touch with one of our technical consultants today.