Skip to content
Main Navigation Puget Systems Logo
  • Solutions
    • Content Creation
      • Photo Editing
        • Recommended Systems For:
        • Adobe Lightroom Classic
        • Adobe Photoshop
        • Stable Diffusion
      • Video Editing & Motion Graphics
        • Recommended Systems For:
        • Adobe After Effects
        • Adobe Premiere Pro
        • DaVinci Resolve
        • Foundry Nuke
      • 3D Design & Animation
        • Recommended Systems For:
        • Autodesk 3ds Max
        • Autodesk Maya
        • Blender
        • Cinema 4D
        • Houdini
        • ZBrush
      • Real-Time Engines
        • Recommended Systems For:
        • Game Development
        • Unity
        • Unreal Engine
        • Virtual Production
      • Rendering
        • Recommended Systems For:
        • Keyshot
        • OctaneRender
        • Redshift
        • V-Ray
      • Digital Audio
        • Recommended Systems For:
        • Ableton Live
        • FL Studio
        • Pro Tools
    • Engineering
      • Architecture & CAD
        • Recommended Systems For:
        • Autodesk AutoCAD
        • Autodesk Inventor
        • Autodesk Revit
        • SOLIDWORKS
      • Visualization
        • Recommended Systems For:
        • Enscape
        • Lumion
        • Twinmotion
      • Photogrammetry & GIS
        • Recommended Systems For:
        • ArcGIS Pro
        • Agisoft Metashape
        • Pix4D
        • RealityCapture
    • AI & HPC
      • Recommended Systems For:
      • Data Science
      • Generative AI
      • Large Language Models
      • Machine Learning / AI Dev
      • Scientific Computing
    • More
      • Recommended Systems For:
      • Compact Size
      • Live Streaming
      • NVIDIA RTX Studio
      • Quiet Operation
      • Virtual Reality
    • Business & Enterprise
      We can empower your company
    • Government & Education
      Services tailored for your organization
  • Products
    • Puget Mobile
      Powerful laptop workstations
      • Puget Mobile 16″
    • Puget Workstations
      High-performance desktop PCs
      • AMD Ryzen
        • Ryzen 9000:
        • Small Form Factor
        • Mini Tower
        • Mid Tower
        • Full Tower
      • AMD Threadripper
        • Threadripper 7000:
        • Mid Tower
        • Full Tower
        • Threadripper PRO 7000WX:
        • Full Tower
      • AMD EPYC
        • EPYC 9004/9005:
        • Full Tower
      • Intel Core Ultra
        • Core Ultra Series 2:
        • Small Form Factor
        • Mini Tower
        • Mid Tower
        • Full Tower
      • Intel Xeon
        • Xeon W-2500:
        • Mid Tower
        • Xeon W-3500:
        • Full Tower
    • Custom Computers
    • Puget Rackstations
      Workstations in rackmount chassis
      • AMD Rackstations
        • Ryzen 9000:
        • R132-4U
        • R550-6U 5-Node
        • Threadripper 7000:
        • T121-4U
        • T120-5U
        • Threadripper PRO 7000WX:
        • T141-4U
        • T140-5U (Dual 5090s)
        • EPYC 9004:
        • E140-4U (Quad 4090s)
      • Intel Rackstations
        • Core Ultra Series 2:
        • C132-4U
        • Xeon W-3500:
        • X131-4U
        • X141-5U
    • Custom Rackmount Workstations
    • Puget Servers
      Enterprise-class rackmount servers
      • Rackmount Servers
        • AMD EPYC:
        • E200-1U
        • E120-2U
        • E140-2U
        • E280-4U
        • E281-4U
        • Intel Xeon:
        • X200-1U
        • X240-2U
    • Comino Grando GPU Servers
    • Custom Servers
    • Puget Storage
      Solutions from desktop to datacenter
      • Network-Attached Storage
        • Synology NAS Units:
        • 4-bay DiskStation
        • 8-bay DiskStation
        • 12-bay DiskStation
        • 4-bay RackStation
        • 12-bay FlashStation
      • Software-Defined Storage
        • Datacenter Storage:
        • 12-Bay 2U
        • 24-Bay 2U
        • 36-Bay 4U
    • Recommended Third Party Peripherals
      Curated list of accessories for your workstation
    • Puget Gear
      Quality apparel with Puget Systems branding
  • Publications
    • Articles
    • Blog Posts
    • Case Studies
    • HPC Blog
    • Podcasts
    • Press
    • PugetBench
  • Support
    • Contact Support
    • Support Articles
    • Warranty Details
    • Onsite Services
    • Unboxing
  • About Us
    • About Us
    • Contact Us
    • Our Customers
    • Enterprise
    • Gov & Edu
    • Press Kit
    • Testimonials
    • Careers
  • Talk to an Expert
  • My Account
  1. Home
  2. /
  3. Hardware Articles
  4. /
  5. Impact of Hardware-Accelerated GPU Scheduling on Content Creation Performance

Impact of Hardware-Accelerated GPU Scheduling on Content Creation Performance

Posted on July 21, 2023 (July 21, 2023) by Evan Lagergren
Always look at the date when you read an article. Some of the content in this article is most likely out of date, as it was written on July 21, 2023. For newer information, see our more recent articles.

Table of Contents

  • Introduction
  • Test Setup
  • Photography
  • Video Editing and Motion Graphics
  • Game Development and Virtual Production
  • CPU Rendering
  • GPU Rendering
  • How Does Hardware-Accelerated GPU Scheduling Affect Content Creation Performance?

TL;DR: Impact of Hardware-Accelerated GPU Scheduling on Content Creation

Enabling Hardware-Accelerated GPU Scheduling has little to no impact on performance in most content creation applications, with most of our tests returning results within the margin of error. The largest difference observed was a 10% increase in performance from enabling the feature in After Effects. GPU rendering also showed some changes in performance, although it can be either better or worse depending on the rendering engine used.

Introduction

Back in May of 2022, Microsoft released an update to Windows to add support for a feature known as hardware-accelerated GPU scheduling. Traditionally, when an application wants to send work to the GPU, the CPU steps in and prioritizes and schedules the requested work so that the GPU can operate more efficiently and responsively. Hardware-accelerated GPU scheduling, on the other hand, pushes some of this work off of the CPU and onto a dedicated processor on the GPU. When enabled, the CPU will handle the prioritization of work while the GPU handles more high-frequency tasks related to task scheduling.

The idea is that offloading some of the work of GPU scheduling from the CPU to the GPU reduces CPU overhead during GPU-intensive tasks without negatively impacting the performance of the GPU. Although Microsoft claims there should not be any noticeable change from enabling hardware-accelerated GPU scheduling, NVIDIA has stated there should be minor improvements to the user experience. However, there have also been reports from users of instability in applications when the feature is enabled, which could make it a double-edged sword.

Now that hardware-accelerated GPU scheduling has been supported for a few years, we decided to see if there was any performance benefit from enabling it when using professional applications.

Black Gigabyte GPU on a blue background, overlayed with a box with
Image
Open Full Resolution

Test Setup

AMD Ryzen 9 Test Platform

CPU: AMD Ryzen 9 7950X 16-core
CPU Cooler: Noctua NH-U12A
Motherboard: ASUS ProArt X670E-Creator WiFi
RAM: 2x DDR5-5600 32GB (64 GB total)
GPUs:
NVIDIA GeForce RTX 4080 16GB
NVIDIA GeForce RTX 3060 Ti 8GB
PSU: Super Flower LEADEX Platinum 1600W
Storage: Samsung 980 Pro 2TB
OS: Windows 11 Pro 64-bit (22621)

AMD Threadripper Pro Test Platform

CPU: AMD Threadripper PRO 5995WX 32-Core
CPU Cooler: Noctua NH-U14S TR4-SP3 (AMD TR4)
Motherboard: Asus Pro WX WRX80E-SAGE SE WIFI
RAM: 8x Micron DDR4-3200 16GB ECC Reg. (128GB total)
GPUs:
NVIDIA GeForce RTX 4080 16GB
NVIDIA GeForce RTX 3060 Ti 8GB
PSU: Super Flower LEADEX Platinum 1600W
Storage: Samsung 980 Pro 2TB
OS: Windows 11 Pro 64-bit (22621)

Intel Core i9 Test Platform

CPU: Intel Core i9-13900K 24-core
CPU Cooler: Noctua NH-U12A
Motherboard: ASUS ProArt Z690-Creator WiFi
RAM: 2x DDR5-5600 32GB (64 GB total)
GPUs:
NVIDIA GeForce RTX 4080 16GB
NVIDIA GeForce RTX 3060 Ti 8GB
PSU: Super Flower LEADEX Platinum 1600W
Storage: Samsung 980 Pro 2TB
OS: Windows 11 Pro 64-bit (22621)

Benchmark Software

Photoshop 24.6 – PugetBench for Photoshop 0.93.6
After Effects 23.3 – PugetBench for After Effects 0.95.6
Premiere Pro 23.5.0 – PugetBench for Premiere Pro 0.98
DaVinci Resolve 18.1.4 – PugetBench for DaVinci Resolve 0.93.2
Unreal Engine 5.2
OctaneBench 2020.1.5
Cinebench R23.2
Blender 3.4.0
V-Ray 5.02

We are testing for the impacts of hardware-accelerated GPU scheduling on three different platforms with two different GPUs (NVIDIA RTX 4080 and NVIDIA RTX 3060 Ti) The 4080 is a solid high-end GPU from this generation, while the 3060 Ti is the lowest class of GPU we would recommend for Content Creation use for those with a low budget. We are not including AMD GPUs as they do not support the feature with their current drivers.

Our CPU platforms include our standard desktop platforms with the Intel 13900K, AMD 7950X, and workstation AMD 5995WX. Although we suspect there may be more of an impact from enabling hardware-accelerated GPU scheduling on low-end CPUs, we do not feel that would be relevant for most professional content creation uses.

We configure all our systems to follow Intel and AMD’s official specifications for CPU operation. This means we disable Precision Boost Overdrive and Thermal Velocity Boost, in addition to any other settings which would cause the system to operate outside manufacturer specifications for voltage, current, or power draw. However, boosting technologies such as Core Performance Boost and Intel Turbo Boost 2.0, which keep the processor within manufacturer guidelines, are enabled.

We performed our testing with our standard content creation suite, featuring Puget Systems Benchmarks on their most recent versions. We will also include results from several other benchmarks, including CPU and GPU rendering engines like V-Ray and Octane and game development benchmarks in Unreal Engine. We are looking at a variety of benchmarks to see possible effects on CPU, GPU, and mixed workloads. Additionally, we suspected that the difference from this setting could be fairly small, so we increased the number of benchmark runs for each test and calculated a 99% confidence interval for each sample of results.

Tower Computer Icon in Puget Systems Colors

Looking for a Content Creation Workstation?

We build computers tailor-made for your workflow. 

Configure a System!
Talking Head Icon in Puget Systems Colors

Don’t know where to start?
We can help!

Get in touch with our technical consultants today.

Talk to an Expert

Photography

Photoshop Overall Score - Higher is Better. 13900K 4080 Enabled: 1695 13900K 4080 Disabled: 1689 13900K 3060 Ti Enabled: 1688 13900K 3060 Ti Disabled: 1663 7950X 4080 Enabled: 1552 7950X 4080 Disabled: 1486 7950X 3060 Ti Enabled: 1535 7950X 3060 Ti Disabled: 1514 5995WX 3060 Ti Enabled: 1092 5995WX 3060 Ti Disabled: 1077 5995WX 4080 Enabled: 1025 5995WX 4080 Disabled: 1108
Image
Open Full Resolution

Starting with Photoshop, we see that enabling hardware-accelerated GPU scheduling has minimal impact on performance. The only results outside of the margin of error are for the 7950X and 4080 combinations and the 5995WX and 4080 combinations, with the prior showing a slight increase in performance and the latter a slight decrease. Overall, enabling hardware-accelerated GPU scheduling will not affect performance in Photoshop.

Video Editing and Motion Graphics

Premiere Pro Extended Overall Score - Higher is Better. 13900K 4080 Enabled: 860.5 13900K 4080 Disabled: 870 7950X 4080 Enabled: 782.75 7950X 4080 Disabled: 785.25 5995WX 4080 Enabled: 777.25 5995WX 4080 Disabled: 779 13900K 3060 Ti Enabled: 669.75 13900K 3060 Ti Disabled: 675.25 5995WX 3060 Ti Enabled: 631.25 5995WX 3060 Ti Disabled: 620 7950X 3060 Ti Enabled: 620.25 7950X 3060 Ti Disabled: 615.25
DaVinci Resolve Extended Overall Score - Higher is Better. 5995WX 4080 Enabled: 2715 5995WX 4080 Disabled: 2829 13900K 4080 Enabled: 2666 13900K 4080 Disabled: 2722 7950X 4080 Enabled: 2661 7950X 4080 Disabled: 2664 5995WX 3060 Ti Enabled: 2007 5995WX 3060 Ti Disabled: 1960 7950X 3060 Ti Enabled: 1921 7950X 3060 Ti Disabled: 1920 13900K 3060 Ti Enabled: 1877 13900K 3060 Ti Disabled: 1852
After Effects Overall Score - Higher is Better. 7950X 4080 Enabled: 1405 7950X 4080 Disabled: 1315 13900K 4080 Enabled: 1399 13900K 4080 Disabled: 1375 7950X 3060 Ti Enabled: 1356 7950X 3060 Ti Disabled: 1328 13900K 3060 Ti Enabled: 1345 13900K 3060 Ti Disabled: 1310 5995WX 4080 Enabled: 1140 5995WX 4080 Disabled: 1074 5995WX 3060 Ti Enabled: 1133 5995WX 3060 Ti Disabled: 1024
Previous Next
System Image
Premiere Pro Extended Overall Score - Higher is Better. 13900K 4080 Enabled: 860.5 13900K 4080 Disabled: 870 7950X 4080 Enabled: 782.75 7950X 4080 Disabled: 785.25 5995WX 4080 Enabled: 777.25 5995WX 4080 Disabled: 779 13900K 3060 Ti Enabled: 669.75 13900K 3060 Ti Disabled: 675.25 5995WX 3060 Ti Enabled: 631.25 5995WX 3060 Ti Disabled: 620 7950X 3060 Ti Enabled: 620.25 7950X 3060 Ti Disabled: 615.25
Open Full Resolution
DaVinci Resolve Extended Overall Score - Higher is Better. 5995WX 4080 Enabled: 2715 5995WX 4080 Disabled: 2829 13900K 4080 Enabled: 2666 13900K 4080 Disabled: 2722 7950X 4080 Enabled: 2661 7950X 4080 Disabled: 2664 5995WX 3060 Ti Enabled: 2007 5995WX 3060 Ti Disabled: 1960 7950X 3060 Ti Enabled: 1921 7950X 3060 Ti Disabled: 1920 13900K 3060 Ti Enabled: 1877 13900K 3060 Ti Disabled: 1852
Open Full Resolution
After Effects Overall Score - Higher is Better. 7950X 4080 Enabled: 1405 7950X 4080 Disabled: 1315 13900K 4080 Enabled: 1399 13900K 4080 Disabled: 1375 7950X 3060 Ti Enabled: 1356 7950X 3060 Ti Disabled: 1328 13900K 3060 Ti Enabled: 1345 13900K 3060 Ti Disabled: 1310 5995WX 4080 Enabled: 1140 5995WX 4080 Disabled: 1074 5995WX 3060 Ti Enabled: 1133 5995WX 3060 Ti Disabled: 1024
Open Full Resolution
Previous Next

Our video editing test results begin much the same as Photoshop, with Premiere Pro showing no difference in scores between enabling or disabling hardware-accelerated GPU scheduling.

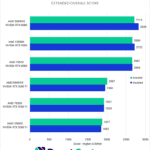
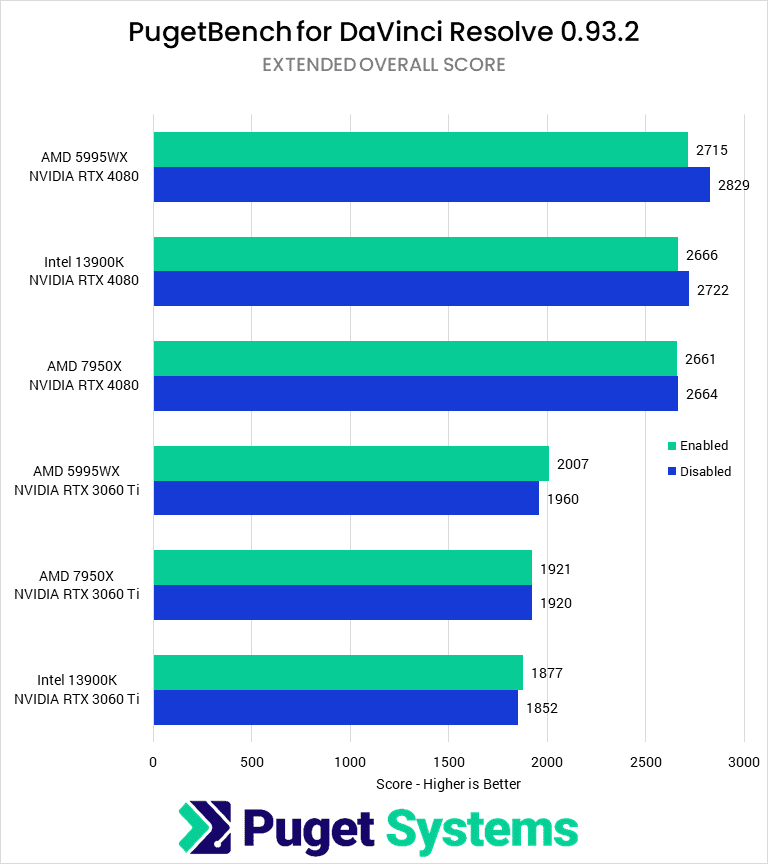
DaVinci Resolve is slightly more interesting as we have one result outside of the margin of error with the 13900K and 4080, though it is still negligible. When looking at the subscores for the Resolve benchmark, all of the tests showed a reduced score in the “GPU Effects” portion of our benchmark, to the tune of about 20%. For most users, the “Overall” score will be a better indicator of actual workflow performance, so we think it is safe to say that enabling GPU scheduling will not affect performance for the average Resolve user.

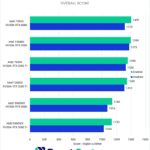
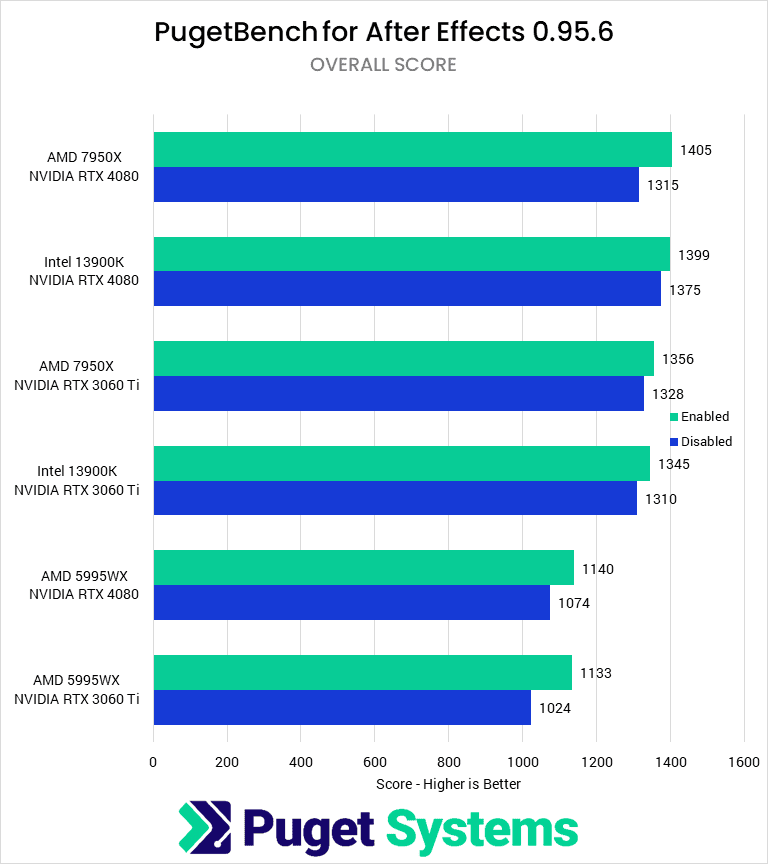
After Effects is the first application we have tested so far that showed a consistent increase in performance with hardware-accelerated GPU scheduling. Although the differences are not large, between 3 and 10%, three of these results are solidly outside the run-to-run variance of these tests; hardware-accelerated GPU scheduling will increase performance in After Effects.

Game Development and Virtual Production

Unreal Engine Render Average Frames Per Second - Higher is Better. 7950X 4080 Enabled: 52.08 7950X 4080 Disabled: 50.52 13900K 4080 Enabled: 51.96 13900K 4080 Disabled: 50.96 5995WX 4080 Enabled: 50.47 5995WX 4080 Disabled: 49.77 13900K 3060 Ti Enabled: 20.05 13900K 3060 Ti Disabled: 19.79 7950X 3060 Ti Enabled: 19.82 7950X 3060 Ti Disabled: 19.76 5995WX 3060 Ti Enabled: 19.74 5995WX 3060 Ti Disabled: 19.67
Unreal Engine 5.2 Shader Compilation and Light Baking Score - Higher is Better. 5995WX 4080 Enabled: 1521 5995WX 4080 Disabled: 1524 5995 3060 Ti Enabled: 1518 5995 3060 Ti Disabled: 1523 7950X 4080 Enabled: 1108 7950X 4080 Disabled: 1061 7950 3060 Ti Enabled: 1098 7950 3060 Ti Disabled: 1103 13900K 4080 Enabled: 983 13900K 4080 Disabled: 956 13900K 3060 Ti Enabled: 940 13900K 3060 Ti Disabled: 948
Previous Next
System Image
Unreal Engine Render Average Frames Per Second - Higher is Better. 7950X 4080 Enabled: 52.08 7950X 4080 Disabled: 50.52 13900K 4080 Enabled: 51.96 13900K 4080 Disabled: 50.96 5995WX 4080 Enabled: 50.47 5995WX 4080 Disabled: 49.77 13900K 3060 Ti Enabled: 20.05 13900K 3060 Ti Disabled: 19.79 7950X 3060 Ti Enabled: 19.82 7950X 3060 Ti Disabled: 19.76 5995WX 3060 Ti Enabled: 19.74 5995WX 3060 Ti Disabled: 19.67
Open Full Resolution
Unreal Engine 5.2 Shader Compilation and Light Baking Score - Higher is Better. 5995WX 4080 Enabled: 1521 5995WX 4080 Disabled: 1524 5995 3060 Ti Enabled: 1518 5995 3060 Ti Disabled: 1523 7950X 4080 Enabled: 1108 7950X 4080 Disabled: 1061 7950 3060 Ti Enabled: 1098 7950 3060 Ti Disabled: 1103 13900K 4080 Enabled: 983 13900K 4080 Disabled: 956 13900K 3060 Ti Enabled: 940 13900K 3060 Ti Disabled: 948
Open Full Resolution
Previous Next

For our game development and virtual production testing, we ran both GPU render and CPU shader compilation/light baking benchmarks in Unreal Engine. In both tests, enabling hardware-based GPU scheduling does not impact performance to a significant degree. There does appear to be a slight advantage in both GPU and CPU scores, but our testing did not give results that would be outside the expected run-to-run variance.

CPU Rendering

V-Ray 5.0.2 CPU Mode Score - Higher is Better. 5995WX 3060 Ti Enabled: 58720 5995WX 3060 Ti Disabled: 60319 5995WX 4080 Enabled: 58119 5995WX 4080 Disabled: 59363 7950X 4080 Enabled: 28631 7950X 4080 Disabled: 27907 7950X 3060 Ti Enabled: 28382 7950X 3060 Ti Disabled: 28681 13900K 4080 Enabled: 23586 13900K 4080 Disabled: 22918 13900K 3060 Ti Enabled: 23376 13900K 3060 Ti Disabled: 23027
Blender 3.4.0 CPU Mode Score - Higher is Better. 5995WX 3060 Ti Enabled: 1254 5995WX 3060 Ti Disabled: 1260 5995WX 4080 Enabled: 1248 5995WX 4080 Disabled: 1254 7950X 4080 Enabled: 578 7950X 4080 Disabled: 567 7950X 3060 Ti Enabled: 577 7950X 3060 Ti Disabled: 578 13900K 4080 Enabled: 475 13900K 4080 Disabled: 473 13900K 3060 Ti Enabled: 469 13900K 3060 Ti Disabled: 469
Cinebench R23 Multi-Core score - Higher is Better. 5995WX 3060 Ti Enabled: 70493 5995WX 3060 Ti Disabled: 69711 5995WX 4080 Enabled: 67393 5995WX 4080 Disabled: 69346 7950X 3060 Ti Enabled: 36910 7950X 3060 Ti Disabled: 36891 7950X 4080 Enabled: 36851 7950X 4080 Disabled: 36321 13900K 3060 Ti Enabled: 29859 13900K 3060 Ti Disabled: 29806 13900K 4080 Enabled: 29657 13900K 4080 Disabled: 30112
Previous Next
System Image
V-Ray 5.0.2 CPU Mode Score - Higher is Better. 5995WX 3060 Ti Enabled: 58720 5995WX 3060 Ti Disabled: 60319 5995WX 4080 Enabled: 58119 5995WX 4080 Disabled: 59363 7950X 4080 Enabled: 28631 7950X 4080 Disabled: 27907 7950X 3060 Ti Enabled: 28382 7950X 3060 Ti Disabled: 28681 13900K 4080 Enabled: 23586 13900K 4080 Disabled: 22918 13900K 3060 Ti Enabled: 23376 13900K 3060 Ti Disabled: 23027
Open Full Resolution
Blender 3.4.0 CPU Mode Score - Higher is Better. 5995WX 3060 Ti Enabled: 1254 5995WX 3060 Ti Disabled: 1260 5995WX 4080 Enabled: 1248 5995WX 4080 Disabled: 1254 7950X 4080 Enabled: 578 7950X 4080 Disabled: 567 7950X 3060 Ti Enabled: 577 7950X 3060 Ti Disabled: 578 13900K 4080 Enabled: 475 13900K 4080 Disabled: 473 13900K 3060 Ti Enabled: 469 13900K 3060 Ti Disabled: 469
Open Full Resolution
Cinebench R23 Multi-Core score - Higher is Better. 5995WX 3060 Ti Enabled: 70493 5995WX 3060 Ti Disabled: 69711 5995WX 4080 Enabled: 67393 5995WX 4080 Disabled: 69346 7950X 3060 Ti Enabled: 36910 7950X 3060 Ti Disabled: 36891 7950X 4080 Enabled: 36851 7950X 4080 Disabled: 36321 13900K 3060 Ti Enabled: 29859 13900K 3060 Ti Disabled: 29806 13900K 4080 Enabled: 29657 13900K 4080 Disabled: 30112
Open Full Resolution
Previous Next

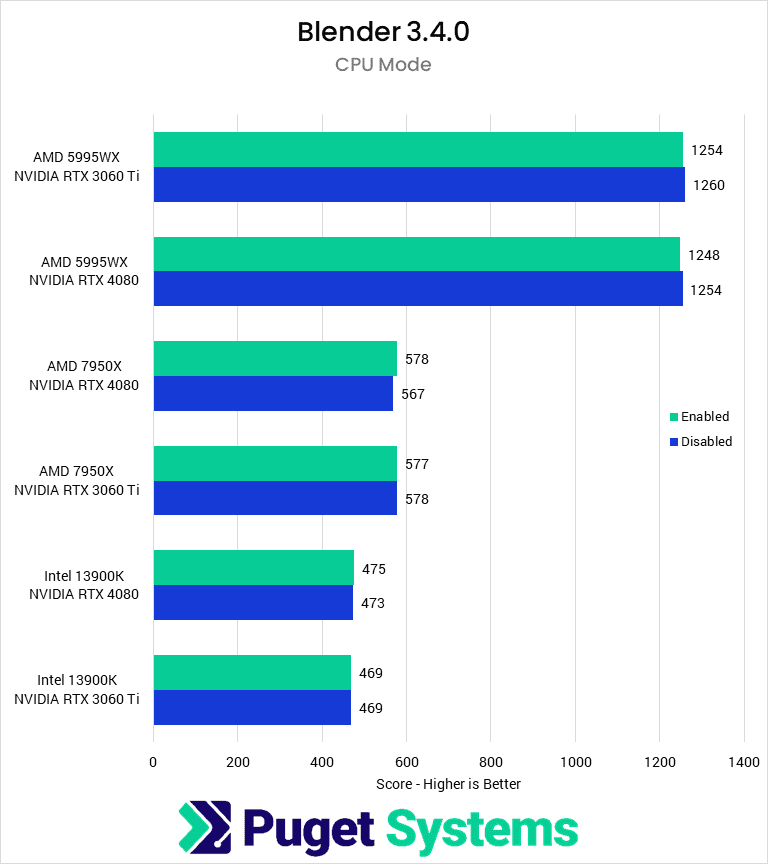
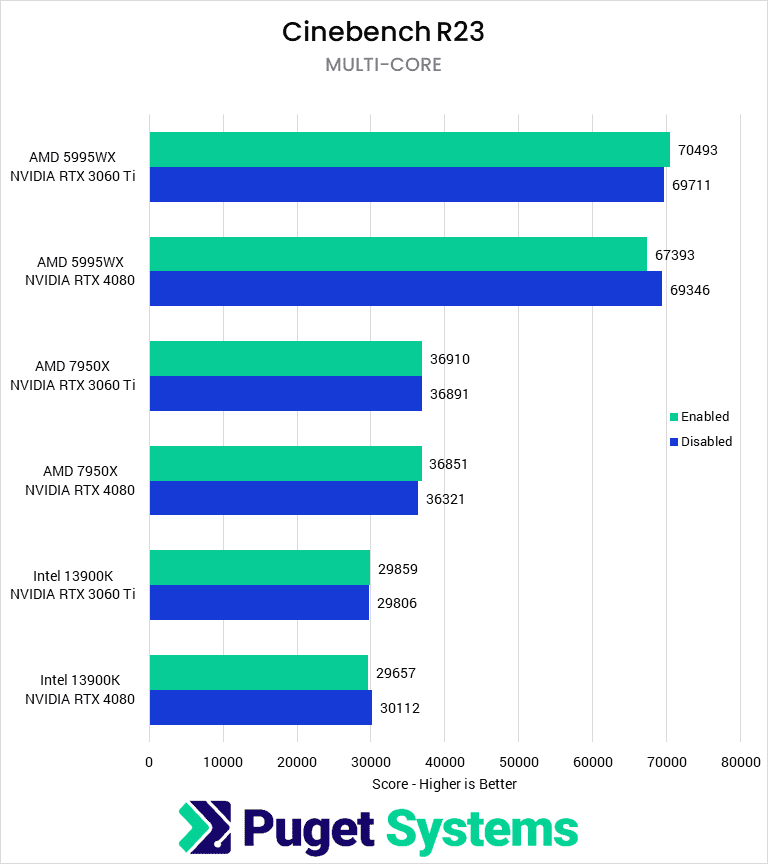
Our CPU rendering benchmarks isolate the CPU for high-intensity tasks, so if CPU-based GPU scheduling had any noticeable impact on CPU performance, we would expect to see that here, with enabling hardware-accelerate GPU scheduling increasing scores.

However, across all three of our benchmarks, we see no impact on scores from enabling the feature. The only test where there may be some theoretical benefit would be in V-Ray with the 5995WX, but even those results were well within the margin of error. Similarly, there was no notable change in scores for Cinebench or Blender.

GPU Rendering

V-Ray 5.0.2.00 RTX Mode - Higher is Better. 7950X 4080 Enabled: 4238 7950X 4080 Disabled: 4360 13900K 4080 Enabled: 4130 1390K 4080 Disabled: 4357 5995WX 4080 Enabled: 4091 5995WX 4080 Disabled: 4262 13900K 3060 Ti Enabled: 1673 13900K 3060 Ti Disabled: 1646 5995WX 3060 Ti Enabled: 1629 5995WX 3060 Ti Disabled: 1593 7950X 3060 Ti Enabled: 1629 7950X 3060 Ti Disabled: 1638
Blender Optix score - Higher is Better. 7950X 4080 Enabled: 9706 7950X 4080 Disabled: 9121 13900K 4080 Enabled: 9619 13900K 4080 Disabled: 9213 5995WX 4080 Enabled: 9504 5995WX 4080 Disabled: 8889 13900K 3060 Ti Enabled: 3314 13900K 3060 Ti Disabled: 3183 5995WX 3060 Ti Enabled: 3252 5995WX 3060 Ti Disabled: 3139 7950X 3060 Ti Enabled: 3252 7950X 3060 Ti Disabled: 3194
Octance Optix Render Score - Higher is Better. 7950X 4080 Enabled: 976 7950X 4080 Disabled: 960 5995WX 4080 Enabled: 971 5995WX 4080 Disabled: 952 13900K 4080 Enabled: 968 13900K 4080 Disabled: 950 5995WX 3060 Ti Enabled: 376 5995WX 3060 Ti Disabled: 372 7950X 3060 Ti Enabled: 376 7950X 3060 Ti Disabled: 375 13900K 3060 Ti Enabled: 376 13900K 3060 Ti Disabled: 374
Previous Next
System Image
V-Ray 5.0.2.00 RTX Mode - Higher is Better. 7950X 4080 Enabled: 4238 7950X 4080 Disabled: 4360 13900K 4080 Enabled: 4130 1390K 4080 Disabled: 4357 5995WX 4080 Enabled: 4091 5995WX 4080 Disabled: 4262 13900K 3060 Ti Enabled: 1673 13900K 3060 Ti Disabled: 1646 5995WX 3060 Ti Enabled: 1629 5995WX 3060 Ti Disabled: 1593 7950X 3060 Ti Enabled: 1629 7950X 3060 Ti Disabled: 1638
Open Full Resolution
Blender Optix score - Higher is Better. 7950X 4080 Enabled: 9706 7950X 4080 Disabled: 9121 13900K 4080 Enabled: 9619 13900K 4080 Disabled: 9213 5995WX 4080 Enabled: 9504 5995WX 4080 Disabled: 8889 13900K 3060 Ti Enabled: 3314 13900K 3060 Ti Disabled: 3183 5995WX 3060 Ti Enabled: 3252 5995WX 3060 Ti Disabled: 3139 7950X 3060 Ti Enabled: 3252 7950X 3060 Ti Disabled: 3194
Open Full Resolution
Octance Optix Render Score - Higher is Better. 7950X 4080 Enabled: 976 7950X 4080 Disabled: 960 5995WX 4080 Enabled: 971 5995WX 4080 Disabled: 952 13900K 4080 Enabled: 968 13900K 4080 Disabled: 950 5995WX 3060 Ti Enabled: 376 5995WX 3060 Ti Disabled: 372 7950X 3060 Ti Enabled: 376 7950X 3060 Ti Disabled: 375 13900K 3060 Ti Enabled: 376 13900K 3060 Ti Disabled: 374
Open Full Resolution
Previous Next

On the flip side of CPU rendering is GPU rendering. Although the hardware used to accelerate GPU scheduling is separate from the rest of the GPU compute hardware, so there should be no impact on rendering performance. But, differences in how scheduling is handled could affect GPU rendering performance, so it is worth checking out.

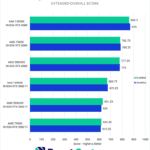
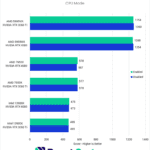
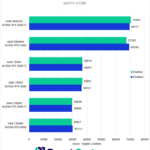
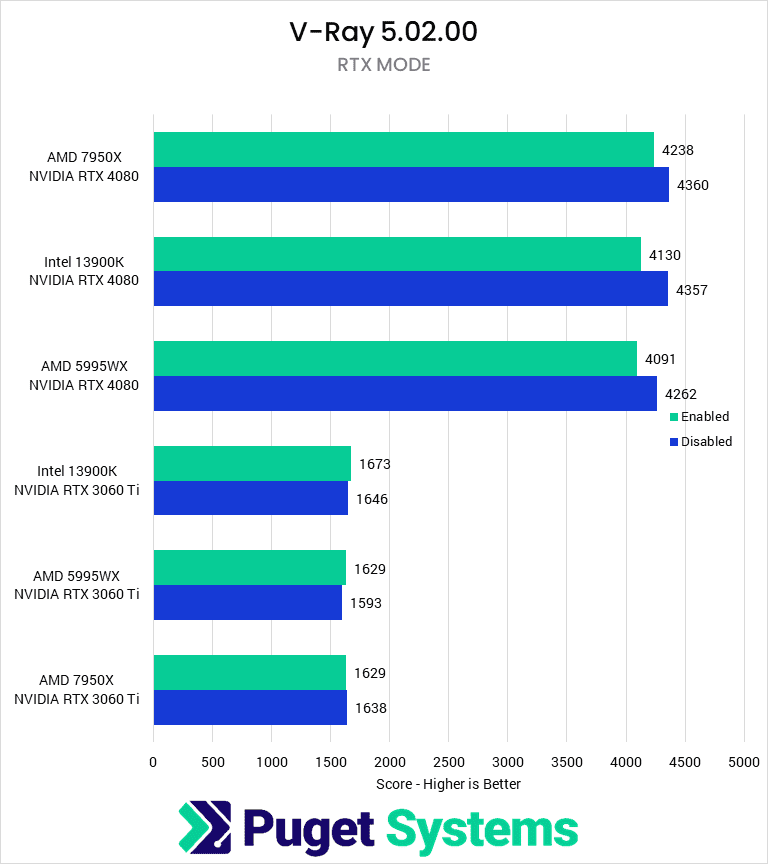
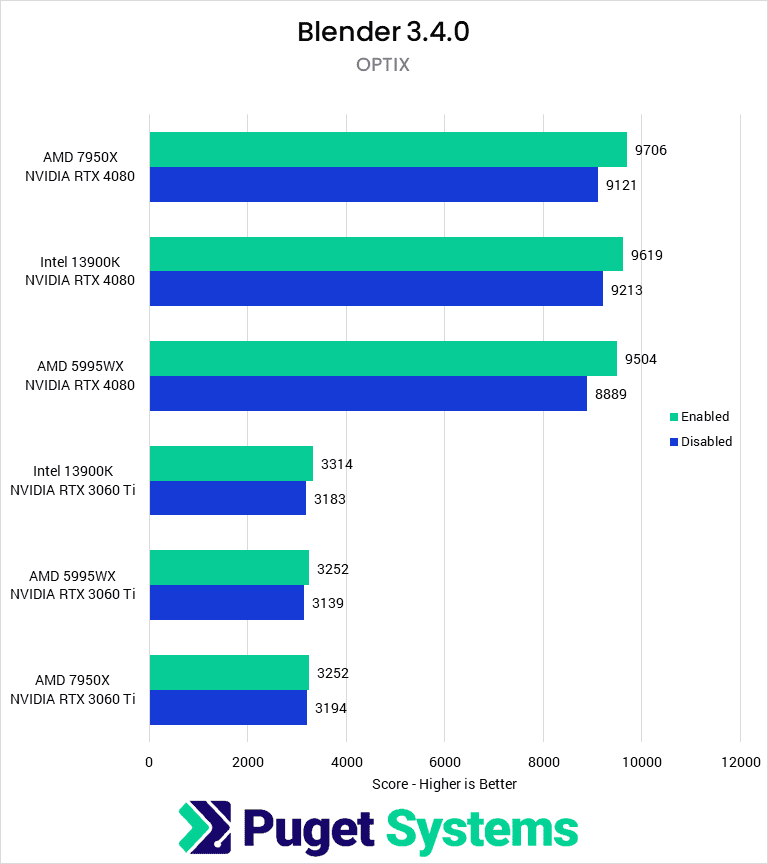
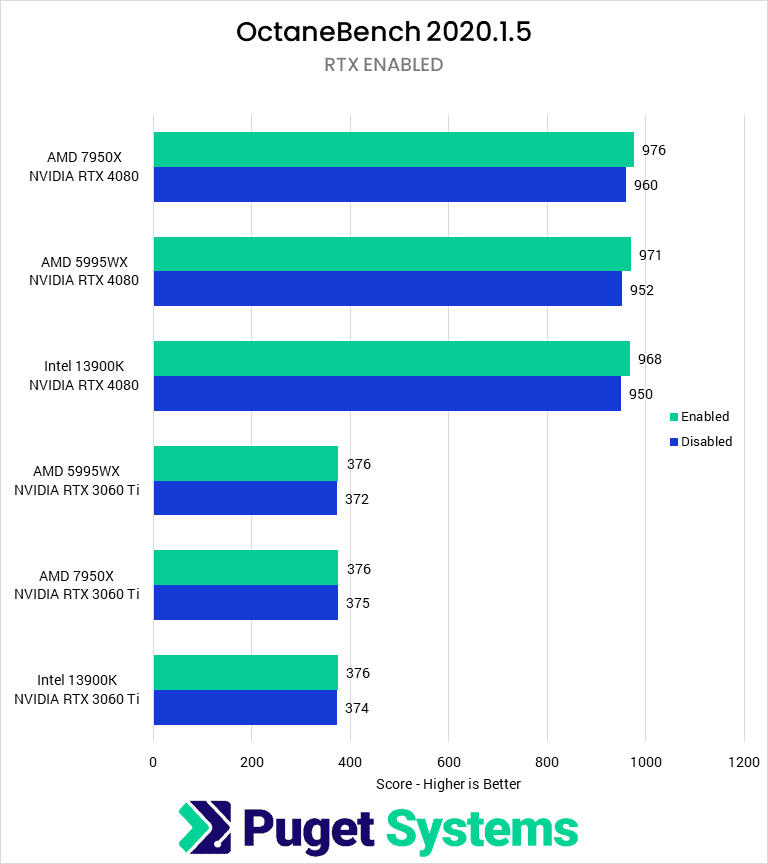
Starting with V-Ray, we see no performance difference for the 3060 Ti, but the RTX 4080 has a performance drop with hardware-accelerated GPU scheduling enabled of about 5%. Blender inverts this, showing a 5% performance increase for the 4080 when the feature is enabled but, again, little change for the 3060 Ti. Octane shows minimal difference with the setting enabled, with a performance increase of only a couple percent.

This makes hardware-accelerated GPU scheduling a very mixed-bag for GPU rendering. It can improve performance, but depending on the rendering engine used, it can also make it worse.

Tower Computer Icon in Puget Systems Colors

Looking for a Content Creation Workstation?

We build computers tailor-made for your workflow. 

Configure a System!
Talking Head Icon in Puget Systems Colors

Don’t know where to start?
We can help!

Get in touch with our technical consultants today.

Talk to an Expert

How Does Hardware-Accelerated GPU Scheduling Affect Content Creation Performance?

Overall, hardware-accelerated GPU scheduling had little effect on content creation performance, with most results being within the margin of error of our testing, including our testing for Photoshop, Premiere Pro, DaVinci Resolve, Unreal Engine, our CPU Rendering benchmarks, and OctaneBench.

The most notable result was After Effects, which had up to 10% increased performance with the setting enabled. GPU Rendering with Blender saw a 5% performance gain, although V-Ray RTX lost about 5% performance with hardware-accelerated GPU scheduling.

Although some users have reported system instability when the feature is enabled – especially in applications with high VRAM usage – we did not observe such issues in our testing. Hardware-accelerated GPU scheduling is a feature that will eventually be the standard way that GPU scheduling is handled in Windows, and enabling it does not seem to have any significant drawbacks for most users. However, if you want to play it safe, based on end-user reports regarding potential instability with this feature, you may want to keep it disabled.

If you are looking for a workstation for any of the applications we tested, you can visit our solutions page to view our recommended workstations for various software packages, our custom configuration page, or contact one of our technology consultants for help configuring a workstation that meets the specific needs of your unique workflow.

Tower Computer Icon in Puget Systems Colors

Looking for a content creation workstation?

We build computers tailor-made for your workflow. 

Configure a System
Talking Head Icon in Puget Systems Colors

Don’t know where to start?
We can help!

Get in touch with one of our technical consultants today.

Talk to an Expert

Related Content

  • Z890 vs. B860 vs. H810
  • AMD Ryzen 9 9950X3D and 9900X3D Content Creation Review
  • Is it Worth Upgrading to NVIDIA’s GeForce RTX 50 Series for 3D Artists?
View All Related Content

Latest Content

  • Unreal Fest 2025: Highlights from Orlando
  • NVIDIA RTX PRO 6000 Blackwell Workstation Content Creation Review
  • Puget Mobile 16″ Laptop (2025) Product Showcase
  • Why PugetBench for Premiere Pro is Dropping HEVC Encoding Tests
View All
Tags: 7950X, After Effects, AMD, Blender, Cinebench, DaVinci Resolve, i9 13900K, Intel, Photoshop, Premiere Pro, Unreal Engine

Who is Puget Systems?

Puget Systems builds custom workstations, servers and storage solutions tailored for your work.

We provide:

Extensive performance testing
making you more productive and giving better value for your money

Reliable computers
with fewer crashes means more time working & less time waiting

Support that understands
your complex workflows and can get you back up & running ASAP

A proven track record
as shown by our case studies and customer testimonials

Get Started

Browse Systems

Puget Systems Mobile Laptop Workstation Icon

Mobile

Puget Systems Tower Workstation Icon

Workstations

Puget Systems Rackmount Workstation Icon

Rackstations

Puget Systems Rackmount Server Icon

Servers

Puget Systems Rackmount Storage Icon

Storage

Latest Articles

  • Unreal Fest 2025: Highlights from Orlando
  • NVIDIA RTX PRO 6000 Blackwell Workstation Content Creation Review
  • Puget Mobile 16″ Laptop (2025) Product Showcase
  • Why PugetBench for Premiere Pro is Dropping HEVC Encoding Tests
  • NVIDIA Blackwell GPU GenAI Software Support
View All

Post navigation

 AMD Radeon PRO W7800 and W7900 Content Creation ReviewStable Diffusion Benchmark Testing Methodology 
Puget Systems Logo
Build Your Own PC Site Map FAQ
facebook instagram linkedin rss twitter youtube

Optimized Solutions

  • Adobe Premiere
  • Adobe Photoshop
  • Solidworks
  • Autodesk AutoCAD
  • Machine Learning

Workstations

  • Content Creation
  • Engineering
  • Scientific PCs
  • More

Support

  • Online Guides
  • Request Support
  • Remote Help

Publications

  • All News
  • Puget Blog
  • HPC Blog
  • Hardware Articles
  • Case Studies

Policies

  • Warranty & Return
  • Terms and Conditions
  • Privacy Policy
  • Delivery Times
  • Accessibility

About Us

  • Testimonials
  • Careers
  • About Us
  • Contact Us
  • Newsletter

© Copyright 2025 - Puget Systems, All Rights Reserved.