Table of Contents
Unreal Engine from Epic Games has exploded in popularity over the past few years. Users in game development, virtual production, and architecture have developed specialized workflows in Unreal engine, and Epic continues to add new features supporting this wide variety of users. This article will go over how we are currently benchmarking Unreal Engine.
CPU Tests
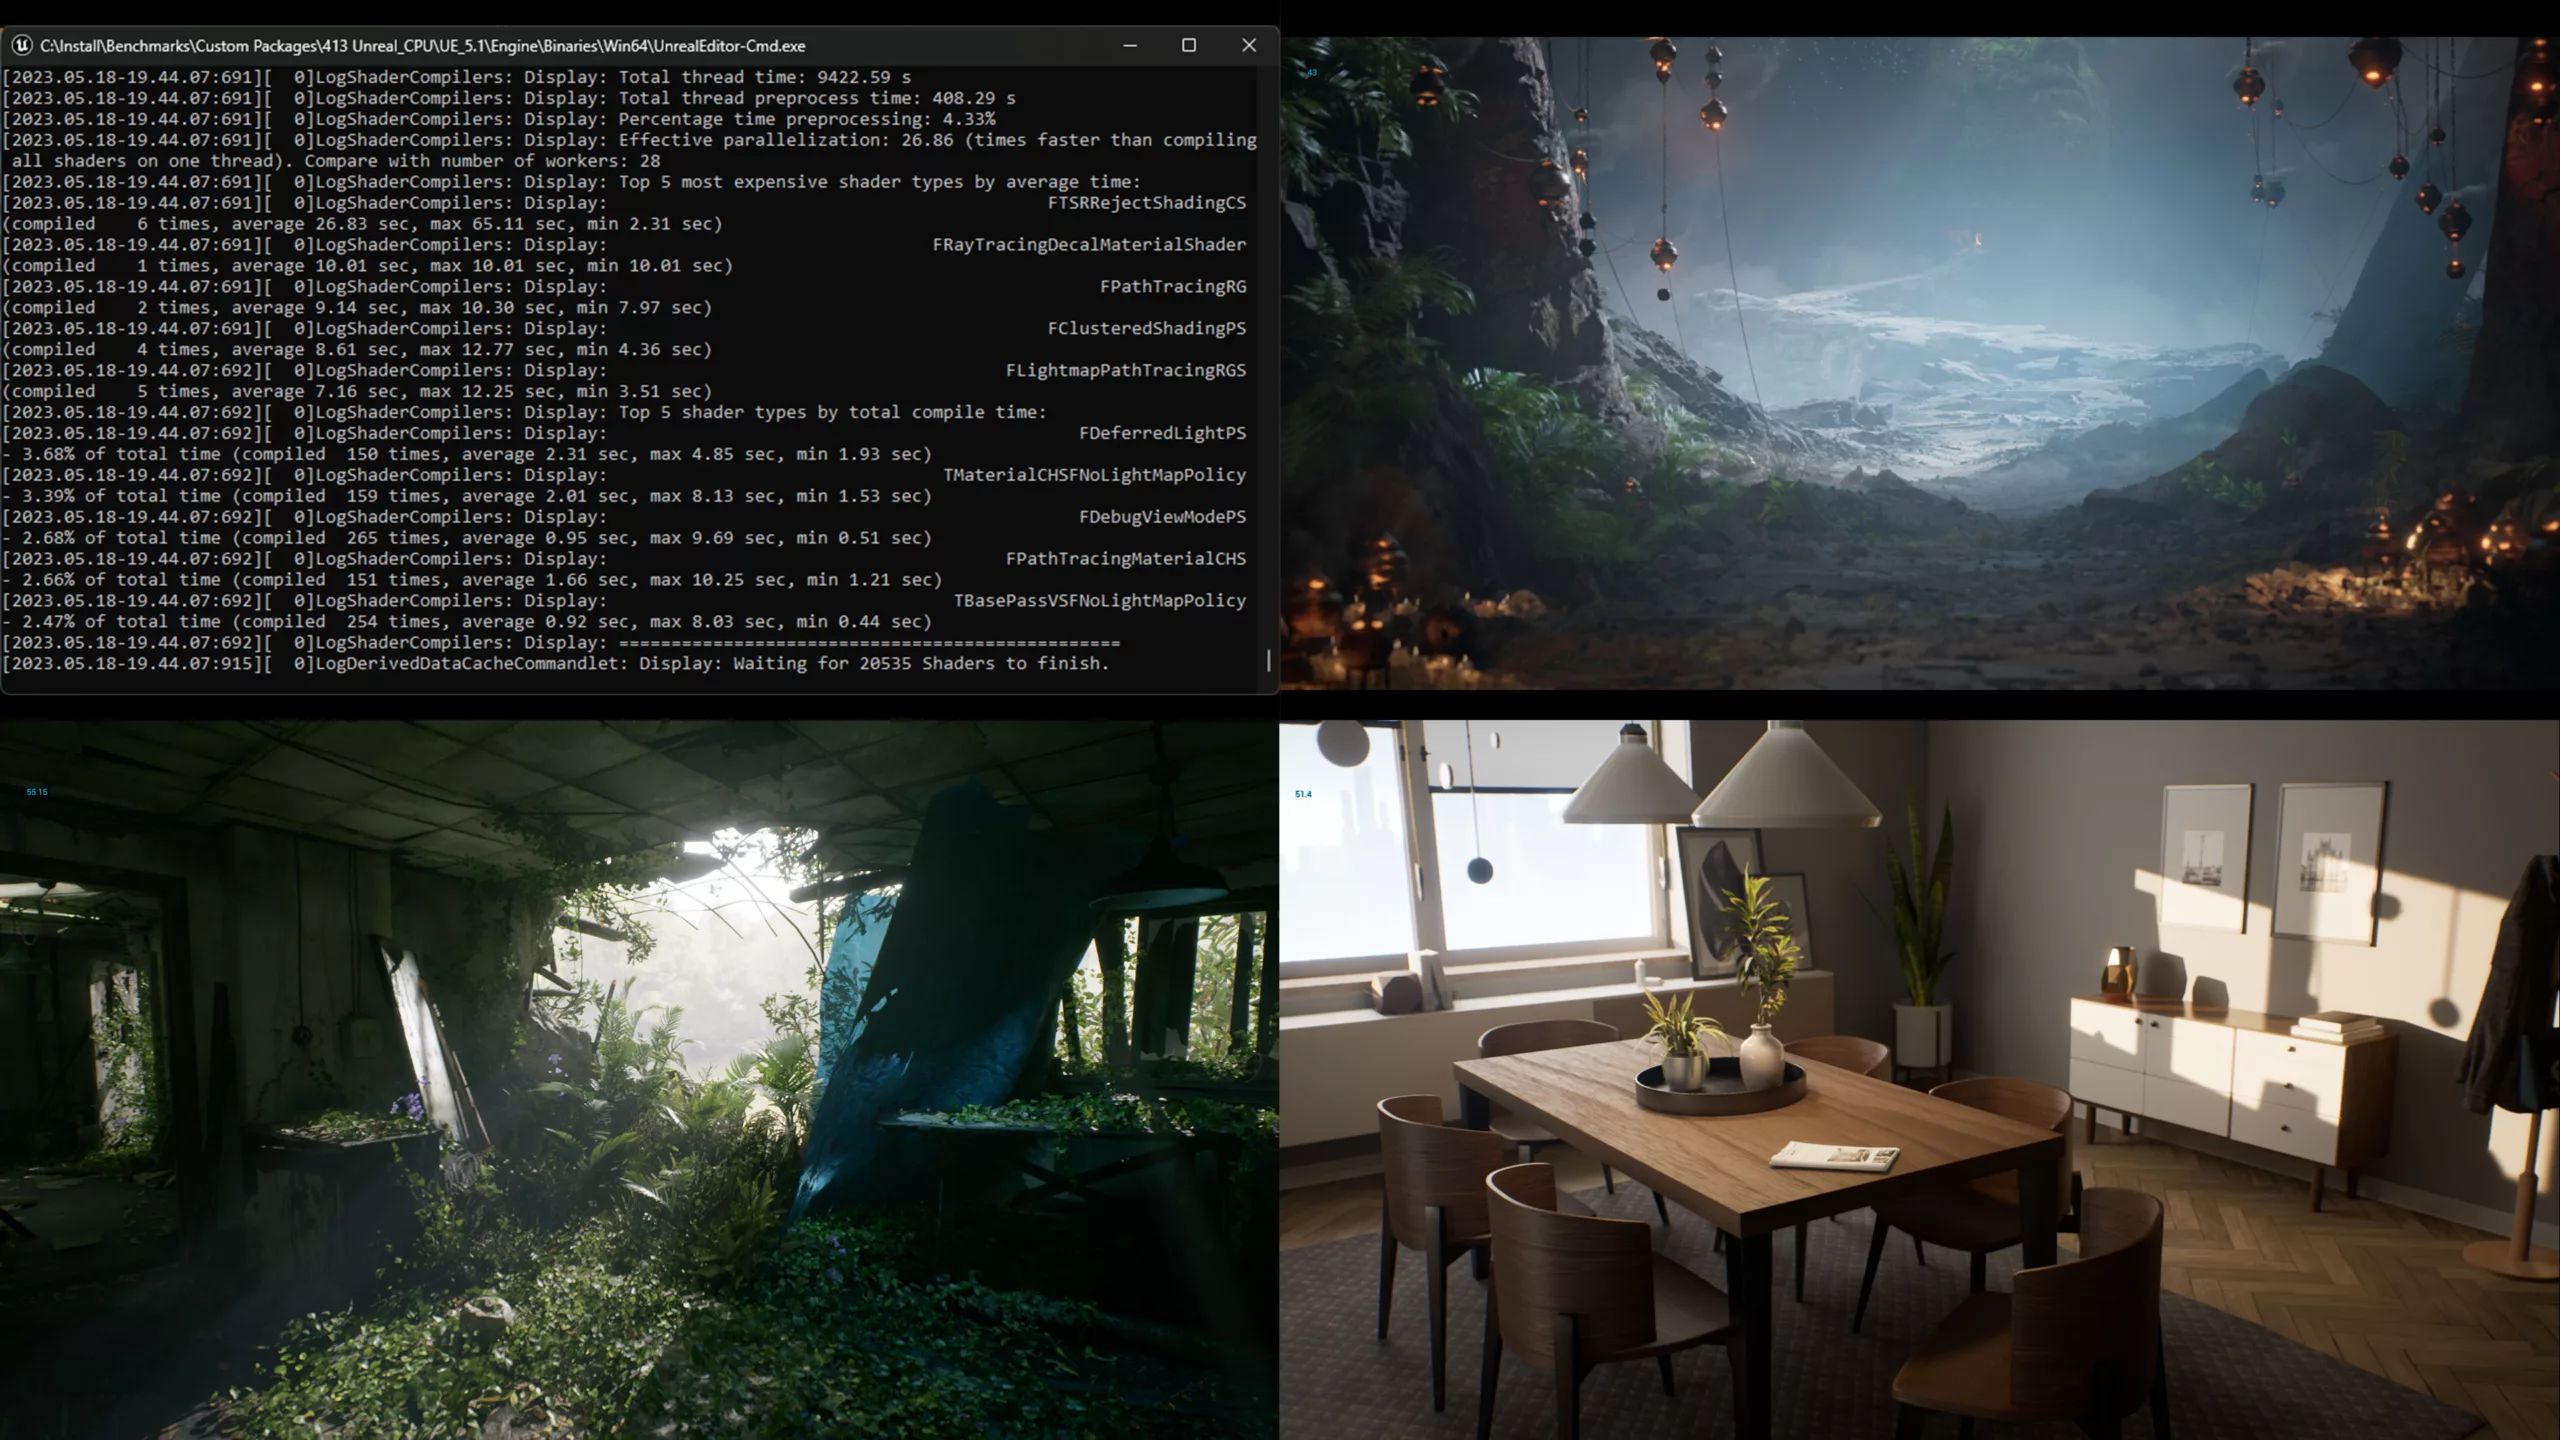
The first section of the Unreal Engine Benchmark focuses on the CPU and tasks that take a while, slowing down productivity. Not every user will face all of these tasks, so it is important to know what each data point represents.
Image
Compiling Source Code
Compiling the source code in Visual Studio 2022 isn’t necessarily Unreal Engine specific. Still, many users, especially those in game development, will pull the source code from GitHub and compile it themselves. Larger studios will perform a nightly build on a dedicated server to compile all changes made across the team. Smaller studios and solo developers may not do a full recompile that often, as most changes can be committed independently. They’ll still want to d a full compile whenever they pull a new build from GitHub or at the end of production when they compile a final build.
Our process here is straightforward. We pulled the latest shipping build of 5.1 and generated the project files per the instructions. We then zipped the unbuilt project and use that as the basis for the testing, as all systems will start with 100% identical content. Then open the project in Visual Studio 2022 and build the engine (or rebuild if it is a second/third/etc. attempt on the same platform). Once the build is complete, we use the completion time reported by Visual Studio. Because it would involve redistributing the source code of the engine, which may have some legal ramifications, this test will not be included in a public release of the benchmark. But it is simple enough for anyone to perform on their own.
Shader Compile
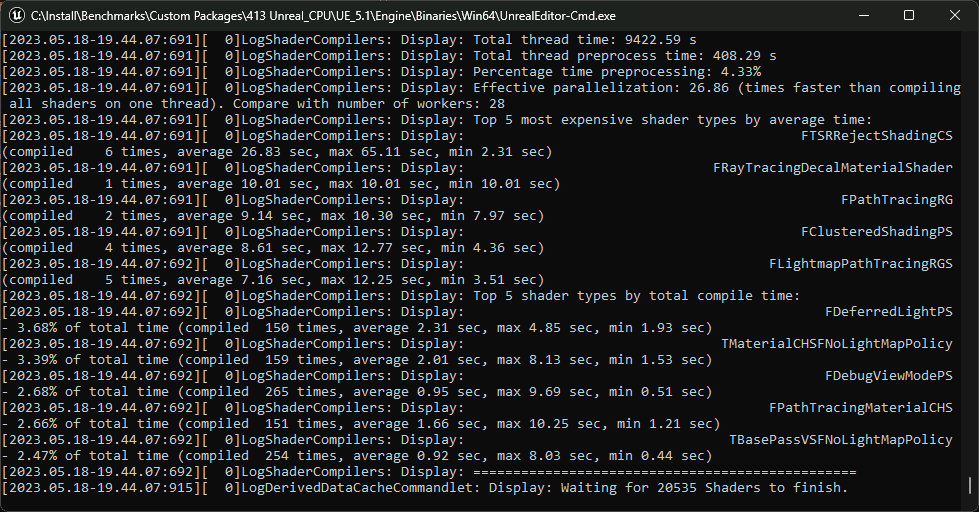
Compiling shaders is the one universal aspect that every Unreal Engine user will face. Shaders compiling happens in two phases. First are the engine shaders. These are compiled when you first open Unreal and take place during the loading screen. Everyone has experienced this at some point when they open a project, only to have to wait several minutes (or hours) with just a splash screen with text saying, “Compiling Shaders 39% Complete). The second phase is the project specific shaders. These start compiling once the project finally loads. You may open a project and see everything is grey, then slowly, materials begin popping in. During this time, users can move around, but it is a bit laggy as the CPU is running at 100% trying to compile. In 5.1 Epic did add the new On Demand Shader feature, so users don’t have to wait for every shader in a project to compile, only the ones actually on screen. It will then compile the rest only when needed. This is really helpful for large projects. Once shaders are compiled, they are saved to the Derived Data Cache, then subsequent loads are much faster. At least until you update the engine, change certain project settings, update drivers, etc., causing the shaders to recompile.
Image
To benchmark this, we needed to make sure all systems were compiling the exact same shaders every time. To do this, we are using the command line version of Unreal that is included in every build. First, we delete the DDC associated with the target project, and then, we can pass the arguments “-run=DerivedDataCache -fill -DDC=CreatePak” while targeting our specific project. This is more in-depth than a standard shader build and is more in line with building a shared DDC with each nightly build.
Build Lighting
This lighting method has been the default for years but is quickly becoming outdated. Features such as real-time ray tracing and Lumen have garnered the headlines over the past few years. However, many users still need to rely on this traditional method. Those wanting to support older hardware or mobile devices still need to use baked lighting. Even amongst users that are baking lighting, many have switched to GPU Lightmass due to its increased speed. There are times when the CPU has its advantages. GPU does not support level streaming, is limited by available VRAM, and does it support the Swarm Agent, which allows for multiple systems to be used simultaneously to build the lighting.
For this test, we use a small architectural scene with all lights set to static. The scene contains a skylight and a few point and rec lights. The quality level is set to “Production.” Again we turn to the command line with arguments “-run=resavepackages , -buildlighting , -quality=Production , -allowcommandletrendering” This performs a full lighting rebuild and then reports a time to complete.
GPU Tests
The GPU is the workhorse in Unreal Engine. It determines what sort of frame rate is possible and how many objects, materials, and effects can be on screen at any moment. Most users are coming to Unreal for its real-time performance, so that is the priority for our testing. Currently, we use three scenes representing typical workflows from higher end game development, ArchViz, and Virtual Production. Each scene’s settings are as follows:
ArchViz Interior

Image
This is a project from Epic that we’ve modified to suit our testing. The goal here is realistic lighting and reflective/mirrored surfaces with detailed reflections. It is using Lumen with Hardware RT enabled. For lighting, there is a skylight, as well as multiple-point lights and emissive materials.
Megascans Abandoned Apartment
Image
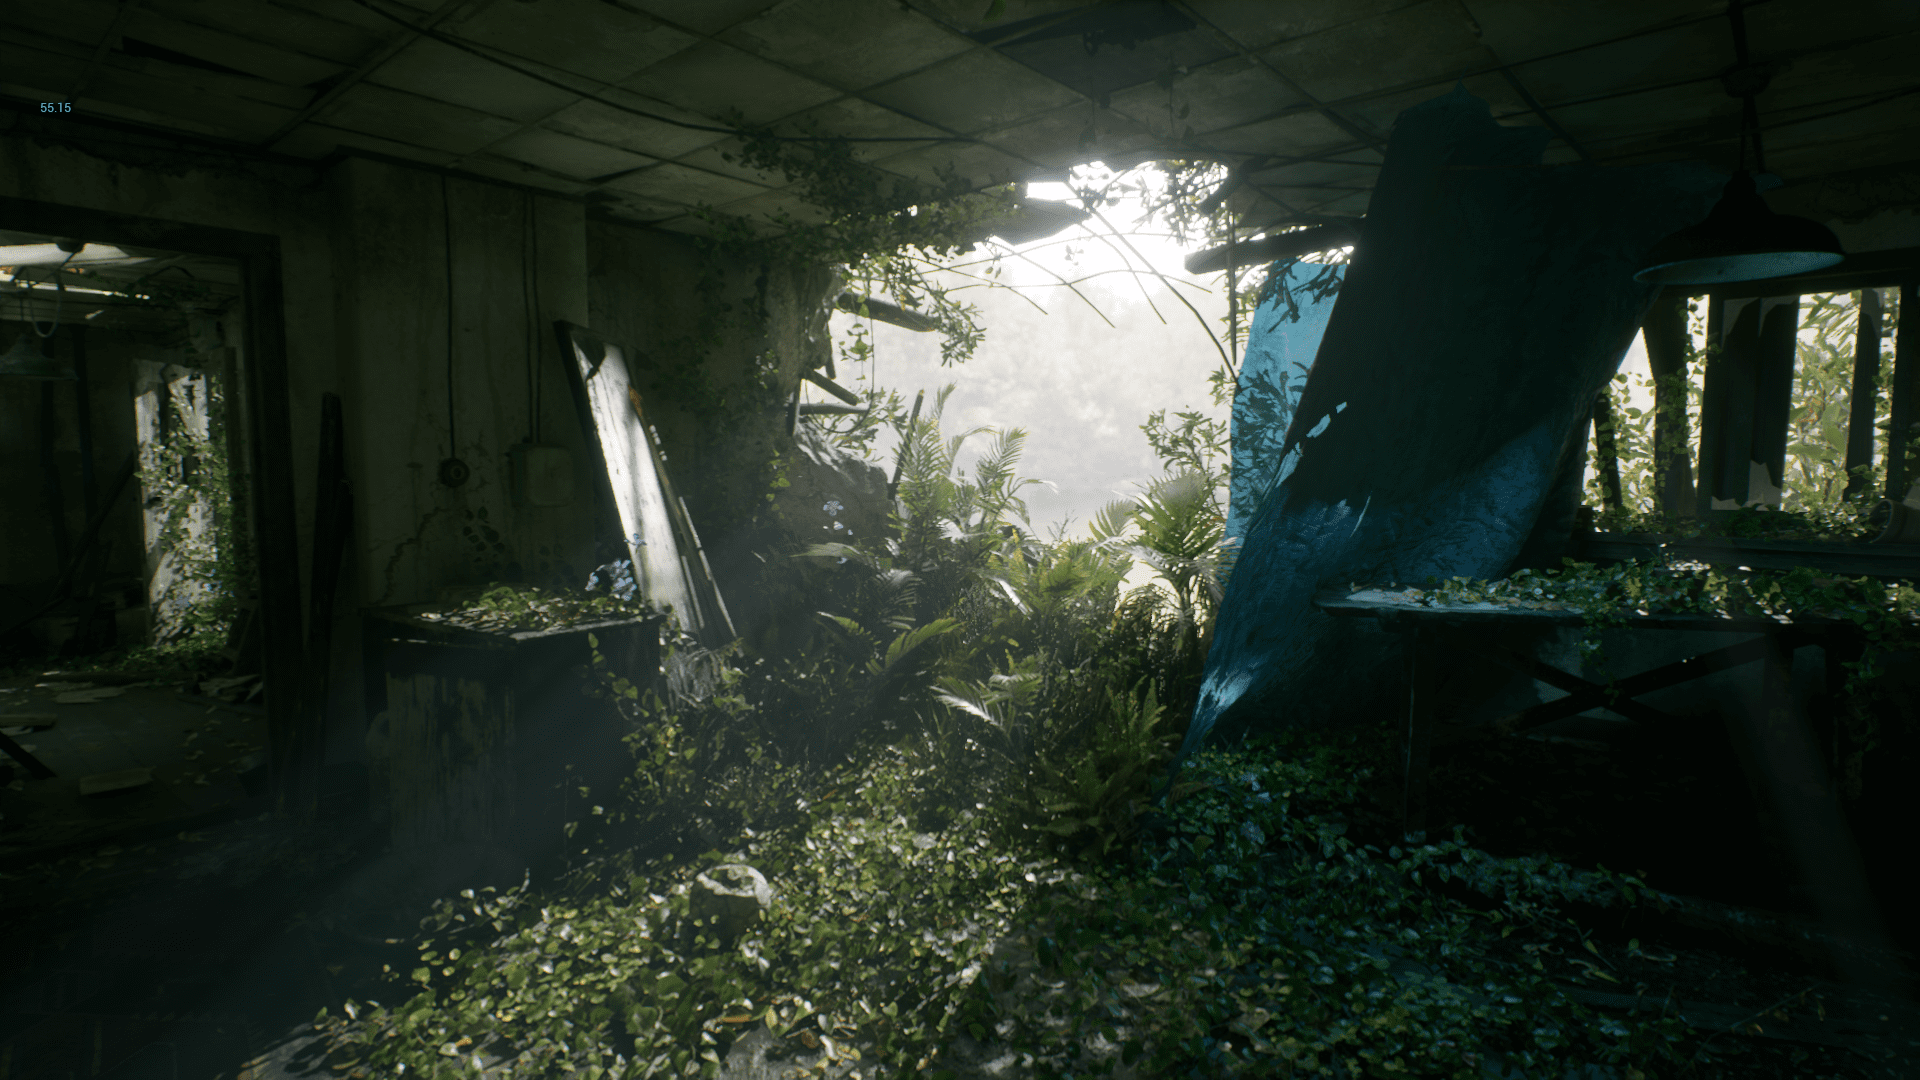
Megascans provides several fantastic sample projects, as well as a wealth of assets for Unreal users. This scene is reminiscent of what you would find in higher-end video games. We modified the lighting in this to be Lumen based instead of Ray Traced and then disabled hardware RT to see how well video cards handle the software ray tracing in Unreal 5.2. The scene also features a lot of foliage, a traditionally difficult thing for engines to render at decent frame rates. There is only one light source, the skylight, so the scene relies heavily on bounced lighting to keep things from being overly dark.
Megascans Goddess Temple

Image
Our final GPU test is also from Megascans. This scene has a lot of light sources, pushing the ray-tracing capabilities of modern graphics cards. There are also more post-processing effects in use here, as well as virtual textures and foliage. Our goal is to represent virtual production workflows where graphical fidelity is paramount. As such, this project uses more VRAM than others and can sometimes exceed lower-end cards.
For our testing, these scenes are run at 1080p, 1440p, and 4k resolutions with an average FPS recorded. That gives us 9 data points to examine. We then compute a geometric mean of these scores to get an overall FPS score.
What’s next
These tests cover most users, but there are more tasks we are working on for future versions of this benchmark. The first test we will add is Path Tracer CPU performance. Unreal’s path tracer was added as a ground truth test to verify real-time lighting setups for accuracy. With the rise of Virtual Production, many users wanted to use this path tracer for cinematic rendering. Every recent release has included updates to the path tracer, and more and more users are adopting it into their workflows. Two components of this need to be examined. Primarily is the GPU performance, which is the bulk of the work. The other component is the denoiser. The default denoiser uses Intel’s Open Image Denoise library, which is a CPU-based process. In motion, the GPU renders one frame, then passes that to the CPU to run the denoising pass. Once that frame is done, the GPU spools back up, renders the next frame, which is then passed to the CPU, and so on, until the scene is complete. This creates alternating spikes in GPU and CPU utilization, so some research is needed to ensure we evaluate each component effectively.
Further, in the future, we will add GPU Lightmass to the testing. Unfortunately, this does not have a command line function (at least not one that is documented), so it will take some investigation to find a way to automate this test reliably. Much like CPU light baking, this is mainly for users that don’t want to use Lumen. Because the demand is low, and regular FPS tests can be used to gauge how well a GPU will work for this, it is low on our priority list. We will also examine the new Procedural Content Generation Framework and ML animation deformers.
Unreal Engine Workstations
Puget Systems offers a range of powerful and reliable systems that are tailor-made for your unique workflow.
Labs Consultation Service
Our Labs team is available to provide in-depth hardware recommendations based on your workflow.
